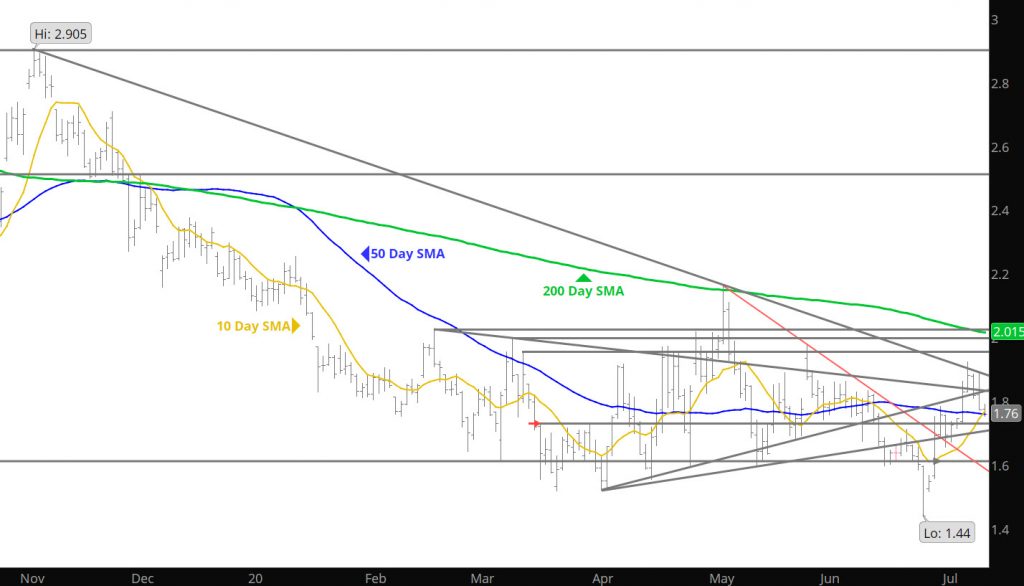
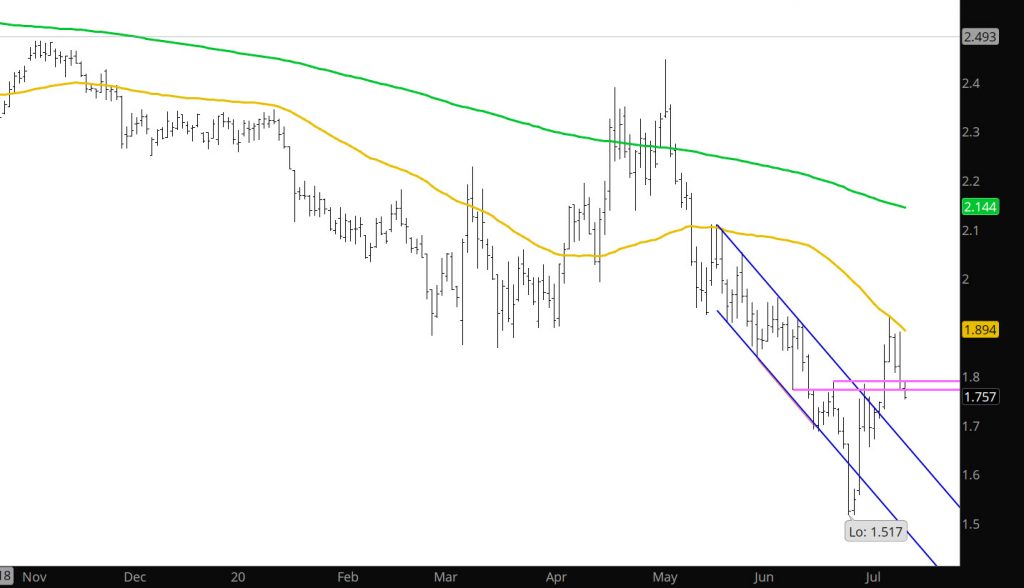
Prices managed to garner enough support to challenge higher levels but could not muster the power to break above the resistance provided from the declining trend line from the Nov ’19 highs and the early May ’20 highs. That level is also matched in the Spot August chart above which has the 50 day SMA at $1.894. Traders found these resistance areas key for selling. Now that the brief rally has failed- we should expect a test of support either side of $1.70 to be tested as the market remains in a range trading environment.
Major Support: $1.484-$1.44, $1.336 Minor Support: $1.527, $1.66, $1.722 Major Resistance: $ $1.864-$1.896 Minor Resistance: