Daily Call

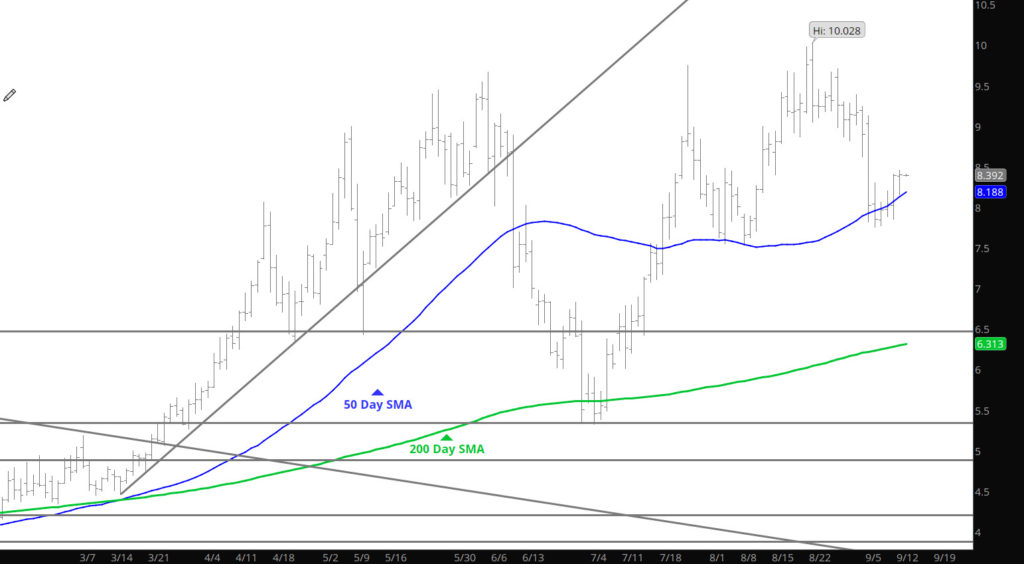
Friday Collapse — A Directional Indication or Short Term Profits
Daily Continuation

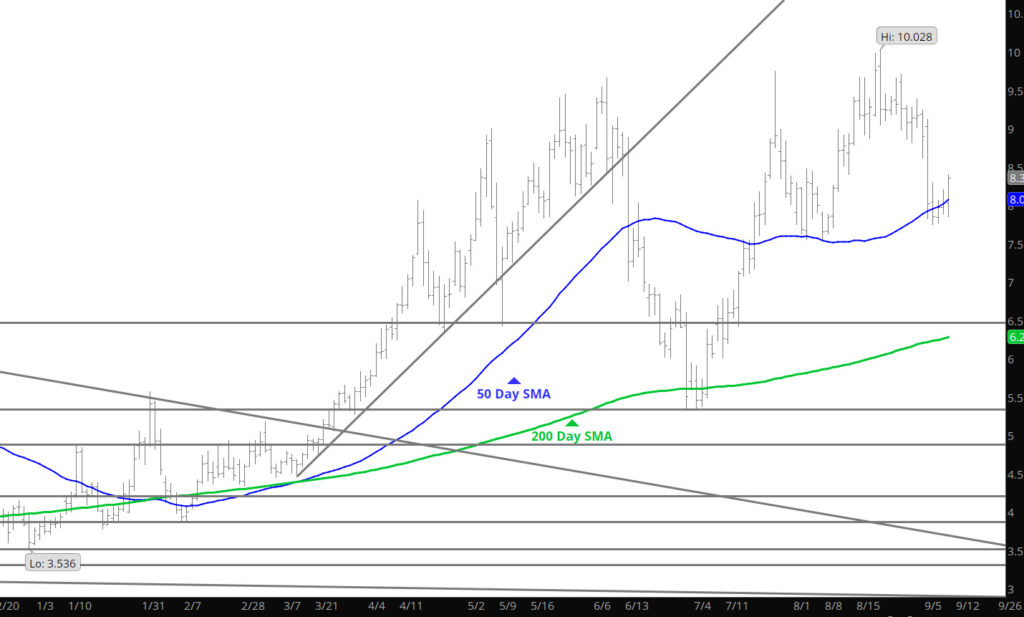
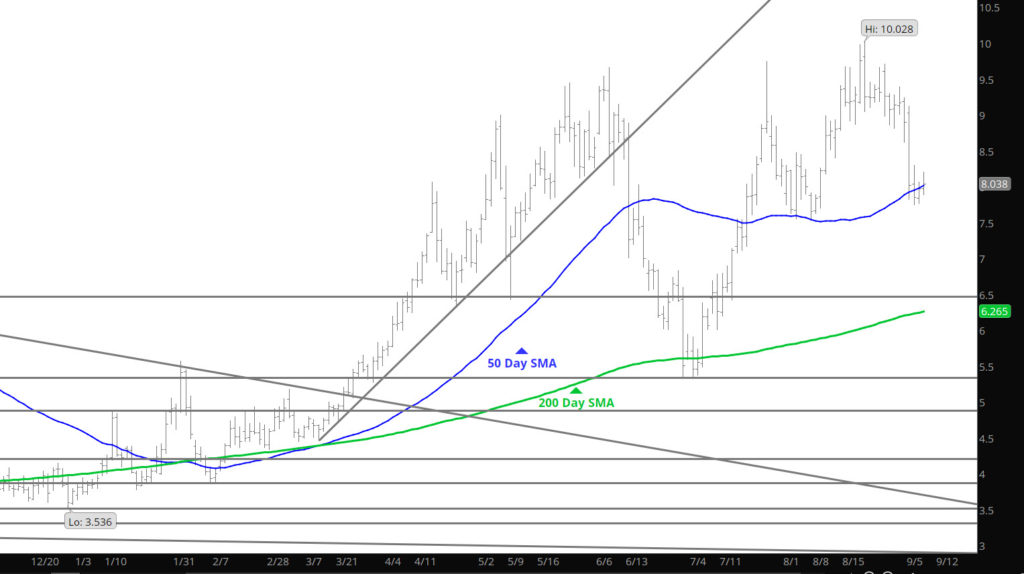
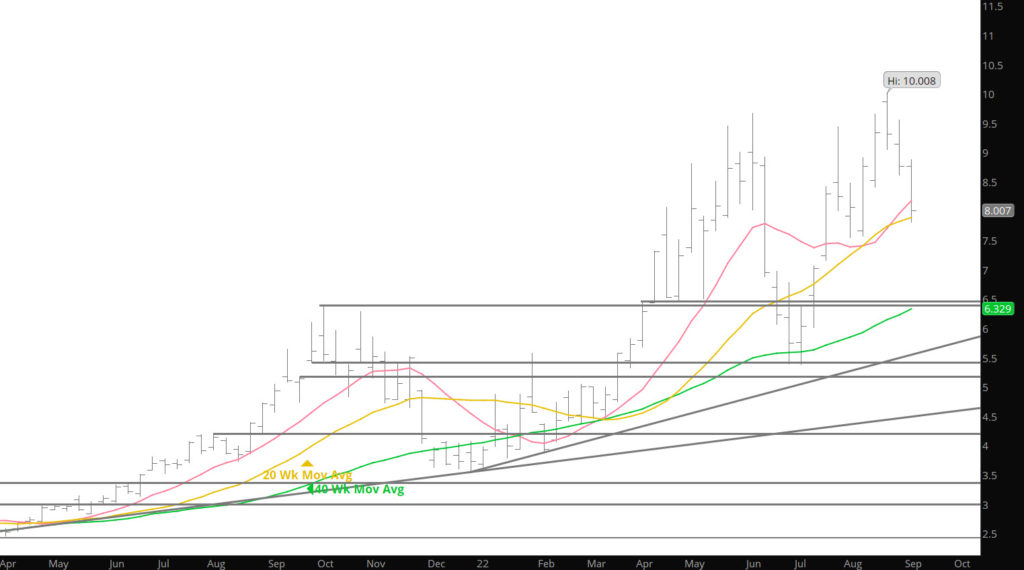
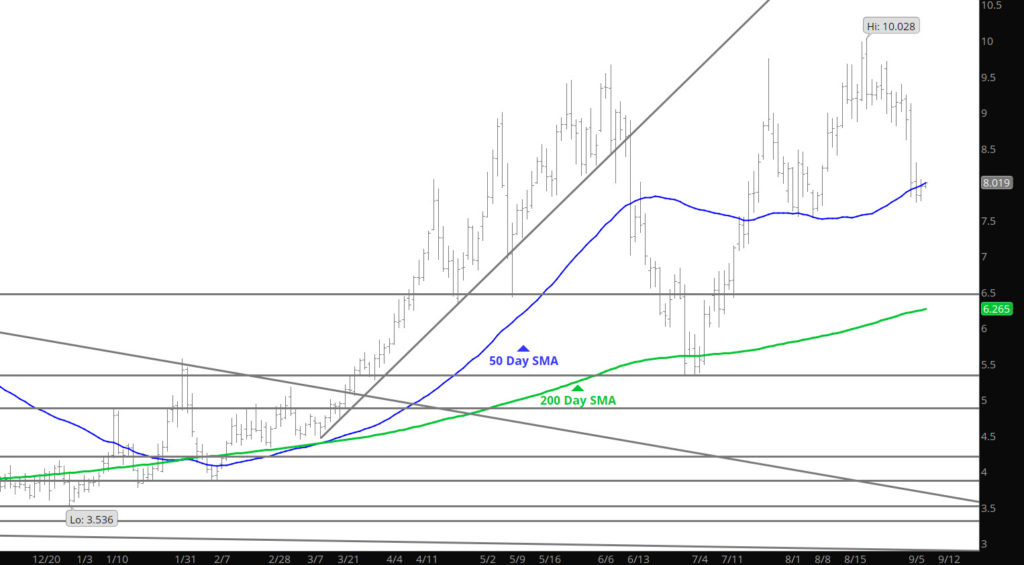
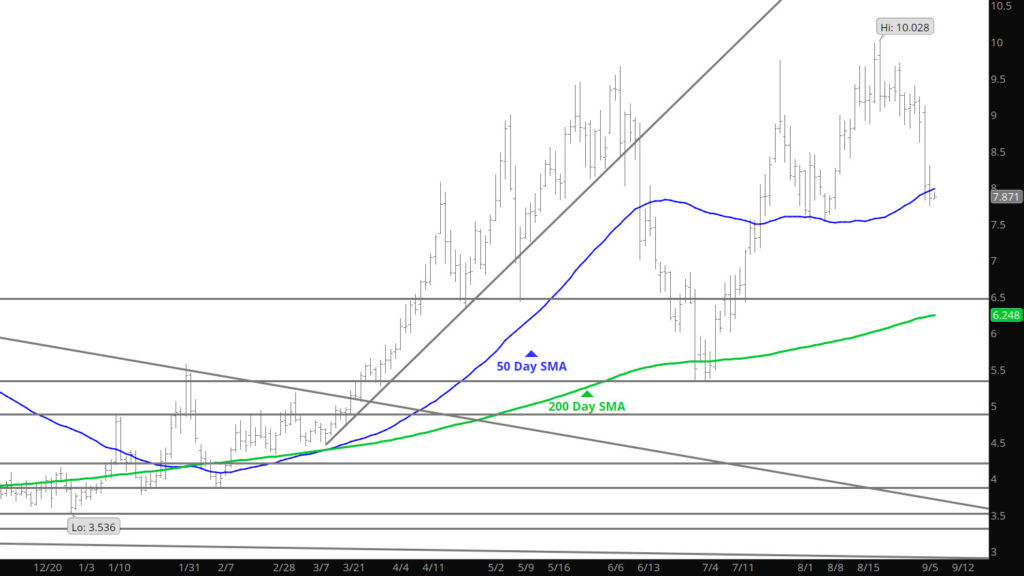
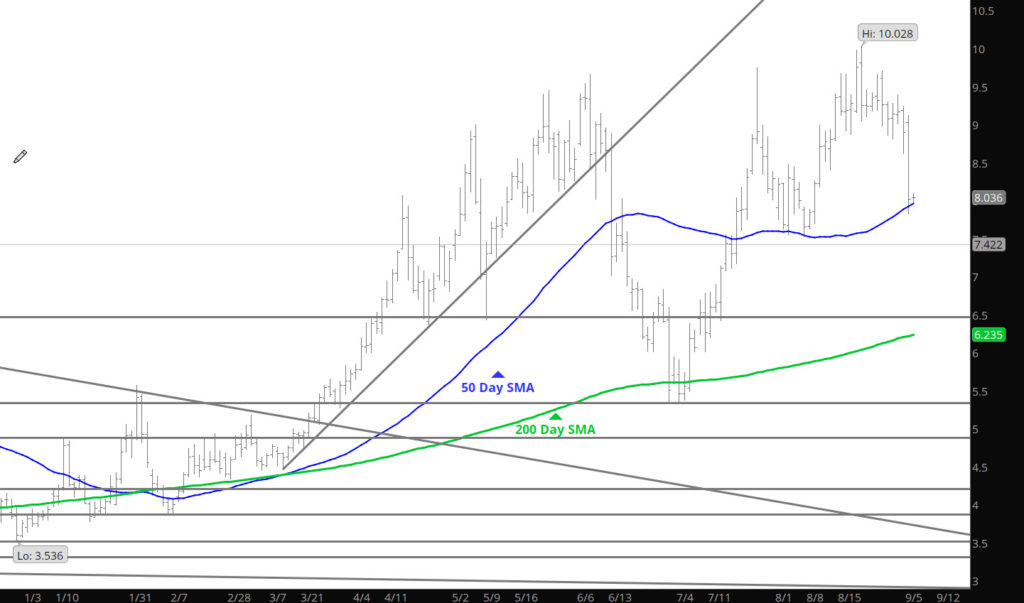
The collapse on Friday is concerning for the bulls, but the general action last week does not show that prices will extend significantly the losses from Friday’s trade. Go into the history about this time of year in the Weekly section, and would not be surprised to see some weakness as prices open today. It remains this analysts view, to follow history showing Q4 highs have been higher than Q3 highs in every year since ’00 except ’01, ’08, ’10, ’11 and ‘14. Be careful here to establish position for the upcoming Q4.

Major Support:$8.47-$8.40, $7.956-$7.91, $7.55, $7.14, $7.078, $6.88, $6.754,$6.38, $6.02, $5.623,
Minor Support$$8.619 $7.35, $7.41, $6.42, $5.548, $5.40-$5.45
Major Resistance: $8.58-$9.021, $9.35, $9.40, 9.664
$9.67, $9.98

To read The Daily Call you must be a subscriber (Current members sign in here. ) Start your subscription today.

A Brief Pause

Daily Continuation

I found an internet signal briefly this afternoon–Please read the Weekly section that was updated today. It seems that the market is establishing whether the recent move was warranted and likely waiting for the upcoming storage report to confirm the recent run.

Major Support:$8.47-$8.40, $7.55, $7.14, $7.078, $6.88, $6.754,$6.38, $6.02, $5.623,
Minor Support$9.36-$9.41, $9.057, $7.35, $7.41, $6.42, $5.548, $5.40-$5.45
Major Resistance: $9.664
, $9.98

To read The Daily Call you must be a subscriber (Current members sign in here. ) Start your subscription today.

Potential Issue

Daily Continuation with Potential Inverted Head and Shoulder Pattern

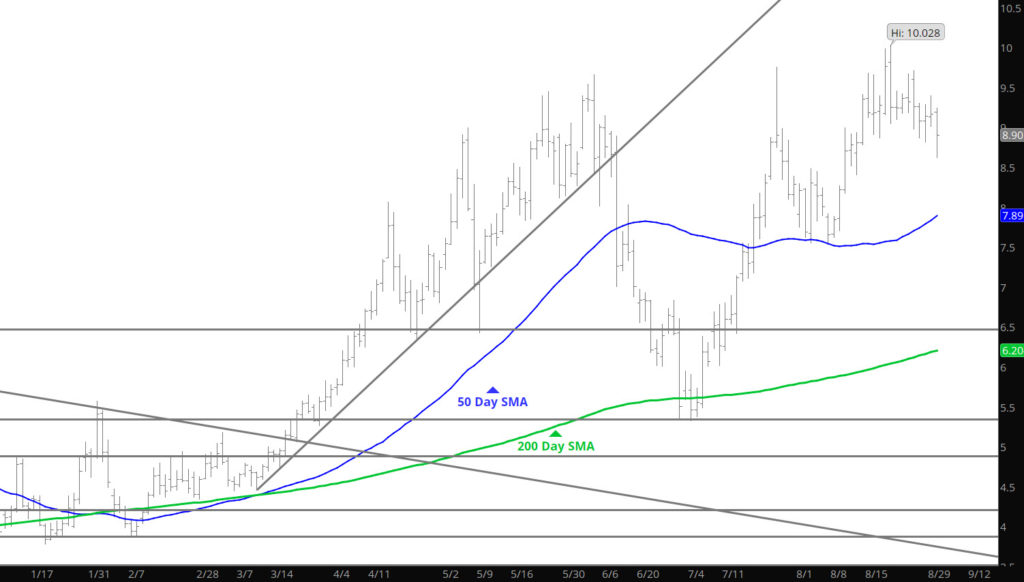
Spoke over the weekend about a technical formation that has the “potential” for issues with Nat gas. It has to deal with the developing inverted head and should pattern in the Daily chart. Not saying that this will happen but would be remiss in not bringing it to you attention. The chart above has the two shoulders and the inverted head highlighted.

Technical doctrine holds that the mathematical objective of the violation of the “neckline” of a fully formed head and shoulders construction is an extension approximately equal to the distance from the top of the head (in this case the bottom) to the neckline. Using that metric suggests a target of $14 (9.670 – 5.325 = 4.345 + 9.670 = 14.015).

To read The Daily Call you must be a subscriber (Current members sign in here. ) Start your subscription today.

Market “Seems” Strong

Weekly Continuation

There will likely be two Weekly reports this week as the market performed and interesting technical formation of late. There will not be a Weekly next week as I have my annual fishing trip to Canada late this week and internet service is sketchy at best.

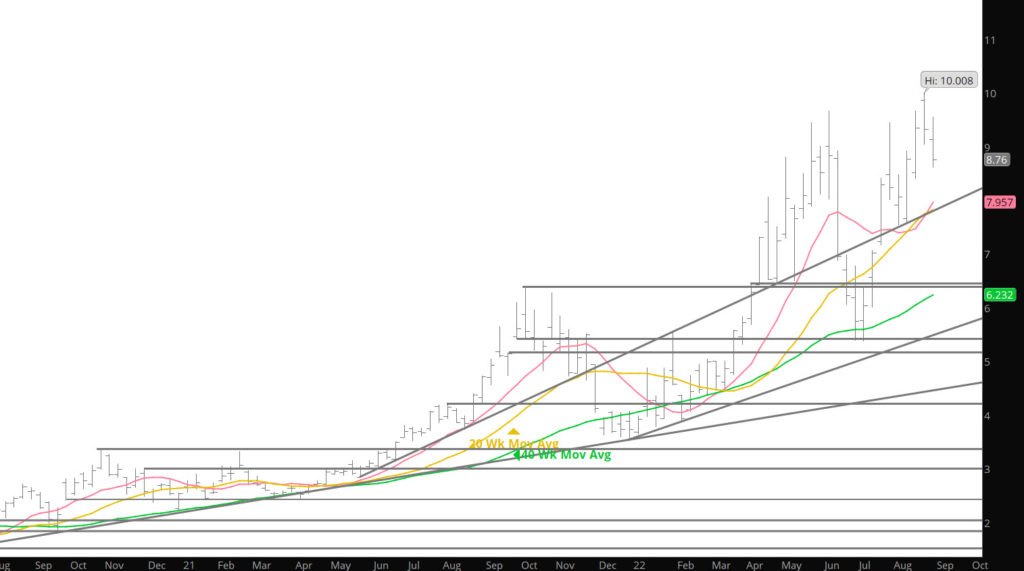
First off lets review last week’s action–While on a trading basis September did fail at lower high ($9.677 v $9.752) on a daily ($9.336 v$9.322) a continuation basis prompt gas set new closing highs. There were new closing highs in the Winter ’22 – ’23 strip ($8.991 v $8.779). To this trader, these are warning signals for the Q4 and Q1 action.

To read The Daily Call you must be a subscriber (Current members sign in here. ) Start your subscription today.

Run Continues? or Light Selling Commences

Daily Continuous

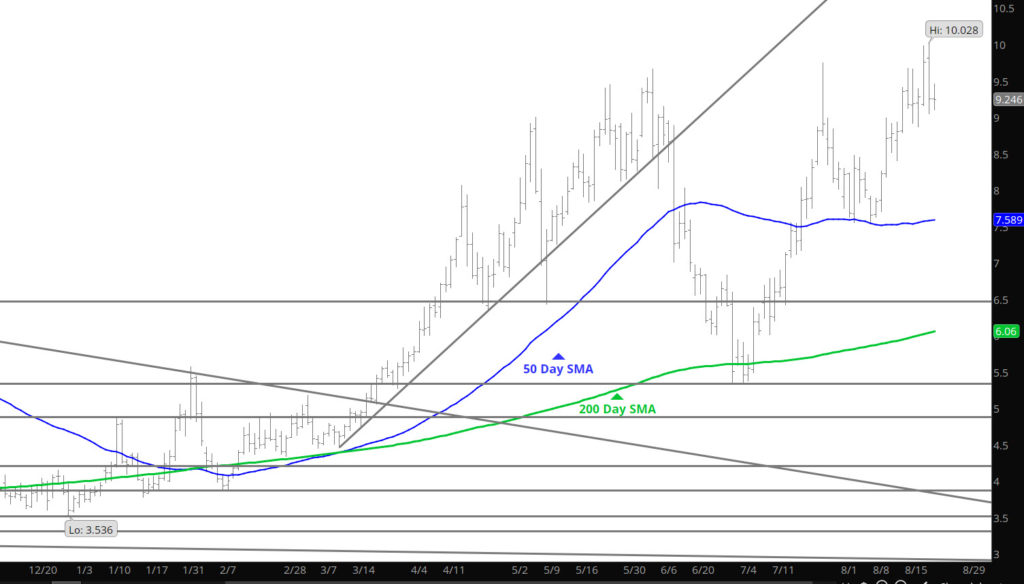
Will go into the aspects and potential interpretation of the inverted head and shoulder formation that seems to be developing in the Daily chart later this week. For now- the inability of prices to break below the $8.90-$9.00 area for a couple of times suggests that a mini-range may be in play. My expectations have been that a decline would challenge the $8.50 area but sellers have run out well before that area has gotten tested.

Major Support:$8.47-$8.40, $7.55, $7.14, $7.078, $6.88, $6.754,$6.38, $6.02, $5.623,
Minor Support:$9.057, $7.35, $7.41, $6.42, $5.548, $5.40-$5.45
Major Resistance: $9369-$9.419-$9.598, $9.664

To read The Daily Call you must be a subscriber (Current members sign in here. ) Start your subscription today.

Resistance Even On a Bullish Report

Daily Continuation

Interesting trade day as the market got a bullish report — rallied– then proceeded to retrace. An interpretation of that behavior suggests that the run in prices needs more drive. Perhaps, a slight retracement to the close or lows from last Friday are coming.

Major Support:$8.47-$8.40, $7.55, $7.14, $7.078, $6.88, $6.754,$6.38, $6.02, $5.623,
Minor Support:$9.057, $7.35, $7.41, $6.42, $5.548, $5.40-$5.45
Major Resistance: $9369-$9.419-$9.598, $9.664

To read The Daily Call you must be a subscriber (Current members sign in here. ) Start your subscription today.

Caution Flag

Daily Continuous

Recommended caution on buying into the Monday rally and yesterday proved why. The bull market is likely to continue into Q4 but there will be better buying opportunities in the next couple of weeks. Doubt there is the opportunity for a lower low than the July low for the Q3 low– that said — you never know for sure. Let the next round of fundamental data (storage release) hit the market and observe the markets reaction– as mentioned in the earlier Daily’s.

Major Support:$8.47-$8.40, $7.55, $7.14, $7.078, $6.88, $6.754,$6.38, $6.02, $5.623,
Minor Support:$9.057, $7.35, $7.41, $6.42, $5.548, $5.40-$5.45
Major Resistance: $9369-$9.419-$9.598, $9.664

To read The Daily Call you must be a subscriber (Current members sign in here. ) Start your subscription today.

The Warning Came on Monday

Daily Continuous

The trade on Monday sent out a warning shot that prices will head higher, perhaps not all week but for the upcoming weeks, expect a solid test of $10.00. Buyers are coming ahead of support zones and there doesn’t seem to be a lot of sellers at resistance zones. Interesting week we are in– tread carefully.

To read The Daily Call you must be a subscriber (Current members sign in here. ) Start your subscription today.

Correction Started — Then Got Lost

Daily Continuation

As expected a correction to test support levels below commenced on the open and ran out of sellers by mid morning. Pay attention to that detail over the next couple of days. If prices can’t test some semi-important support levels before buyers come in — my expectations may not be met. This week will prove very important to trade going into expiration and the seasonal weakness associated with Labor Day.

Major Support:$8.04, $7.55, $7.14, $7.078, $6.88, $6.754,$6.38, $6.02, $5.623,
Minor Support:$7.35, $7.41, $6.42, $5.548, $5.40-$5.45
Major Resistance: $8.95, $8.996-$9.057

To read The Daily Call you must be a subscriber (Current members sign in here. ) Start your subscription today.

Late Summer Range Continues

Weekly Continuation

Since the June Q2 high it has been expected that prompt gas would define a summer trading range not from the July low to the June high (nearly $4 between the upper and lower extremes) and perhaps the trade in the last couple of weeks has develop a narrower range. While the question is not completely settled, the rallies of the last two weeks go a long way toward tightening the lower boundary of that range just above $7.500 and the June highs. Would continue to expect a tighter range to be defined.

Calendar August (with Sept as prompt) has historically been a period of seasonal weakness, occasionally spilling over to the first part of September. Even in the last two years when there has been counter – seasonal strength during September’s tenure the prompt traded down from highs in early August. Last year prompt September traded from $4.205 down to $3.734 on 08/19.

Volatility remains extreme–the total range traded this week was $1.387…the weekly ATR (average true range of the last fifteen weeks) is $1.392. A year ago the 15 – week average was $.271. Volume was slightly higher (25,000 average daily) but open interest continued to decline slightly. A large portion of the declines in OI was Thursday on a high volume day as prices rallied from $8.22 to the week’s high just short of $9.00 after the storage inventory release.

Continue to expect higher prices during Q4 & potentially into Q1. It is worth remembering that the rallies from Q3 lows have averaged about 74% over the last twenty years (60% over the last ten, 76% over the last five) and that Q4 highs have been higher than Q2 highs fourteen of twenty times. Q4 highs have been higher than Q3 highs in every year since ’00 except ’01, ’08, ’10, ’11 and ‘14.

Major Support: $7.55, $7.14, $7.078, $6.88, $6.754,$6.38, $6.02, $5.623,
Minor Support:$7.35, $7.41, $6.42, $5.548, $5.40-$5.45
Major Resistance: $8.95, $8.996-$9.057