To read The Daily Call you must be a subscriber (Current members sign in here. ) Start your subscription today.
Daily Call
Prices Reverse Off of A 13 Year High Trade
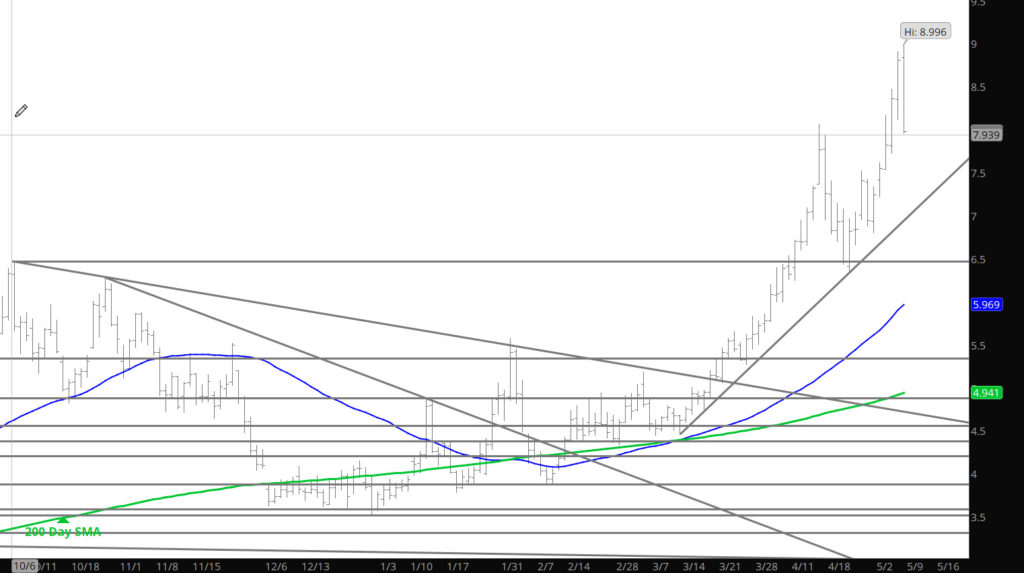
Prompt May extended the rally from the previous meager test of its 20 – day SMA for six straight trading days, rising $2.191, before reversing. On Friday May fell more than a dollar from the highest price traded in 13+ years and ended the week back below the April high (perhaps significant). Despite the decline during Friday’s outside day reversal, prompt gas still finished the week $.799 higher.
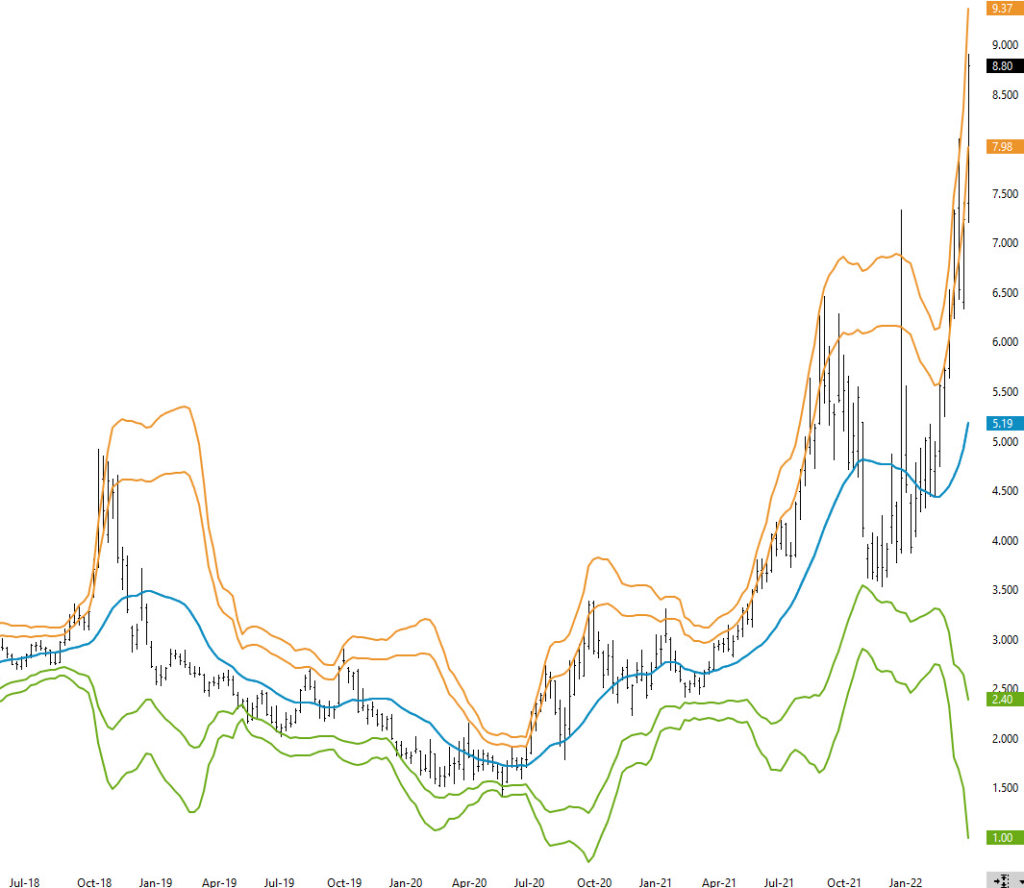
The gas market is extremely overbought by most all of my metrics. The weekly MACD the primary lagging indicator (used sparingly here but monitored on an every week basis for the last thirty years) has exceeded its extreme reading coincident with last year’s high. Simultaneously, the weekly RSI, the primary leading indicator, is yet to confirm the April high (RSI should confirm the weekly high with a higher close).
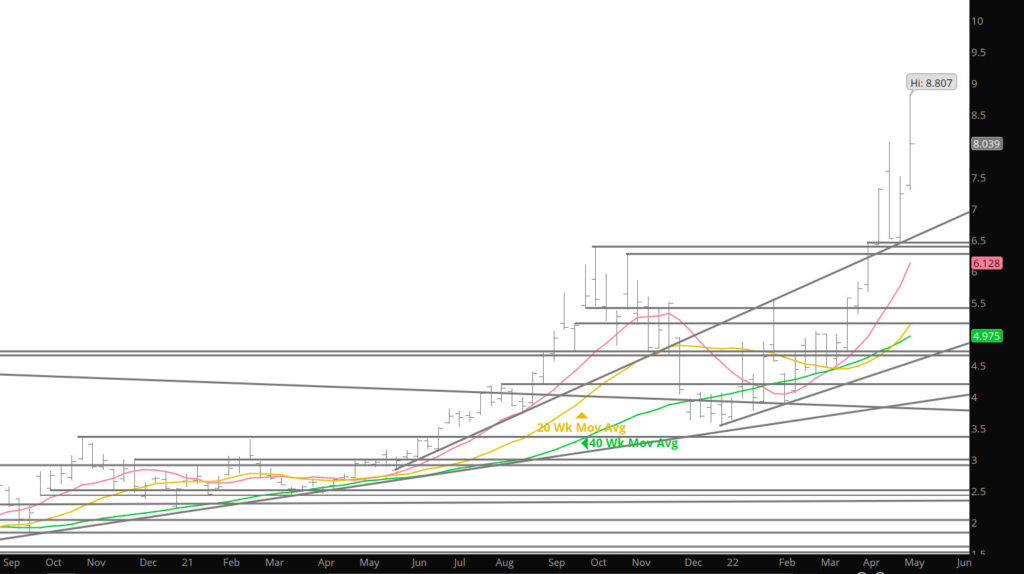
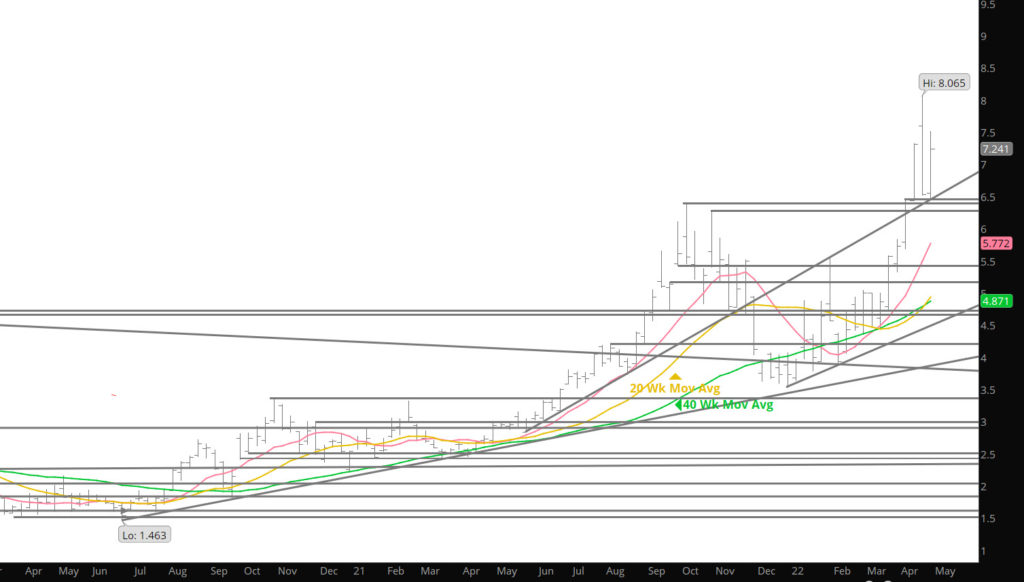
Prompt gas is extended more than 50% above the intermediate long – term trend defining 40 – week SMA. Since (and including ’00) this is the ninth time prompt gas has been extended this far. Currently, separation from the rising moving average measures 60.8%. Last fall weekly closing prices remained more than 50% above the moving average for seven weeks and at the peak the separation was 67.5% before the decline toward the December low began. The one factor that each of the prior occurrences has in common is that once the regression begins the decline to the mean is rapid. Ten weeks after last fall’s peak extension prompt gas closed below the 40 – week SMA.
Prompt gas traded to three standard deviations above the twenty – week SMA for the third time in four weeks. Last fall there was a nearly identical sequence before prompt gas returned to the 20 – week SMA. Markets in definable trends typically respect shorter term moving averages. Without exception, every expiring contract for more than a year has settled above its 20 – day SMA. More often than not that relatively short–term moving average has been tested and held during the middle of the prompt and presenting a low risk buying point. Expect June to test its 20 – day during its tenure, before a rally into expiration.
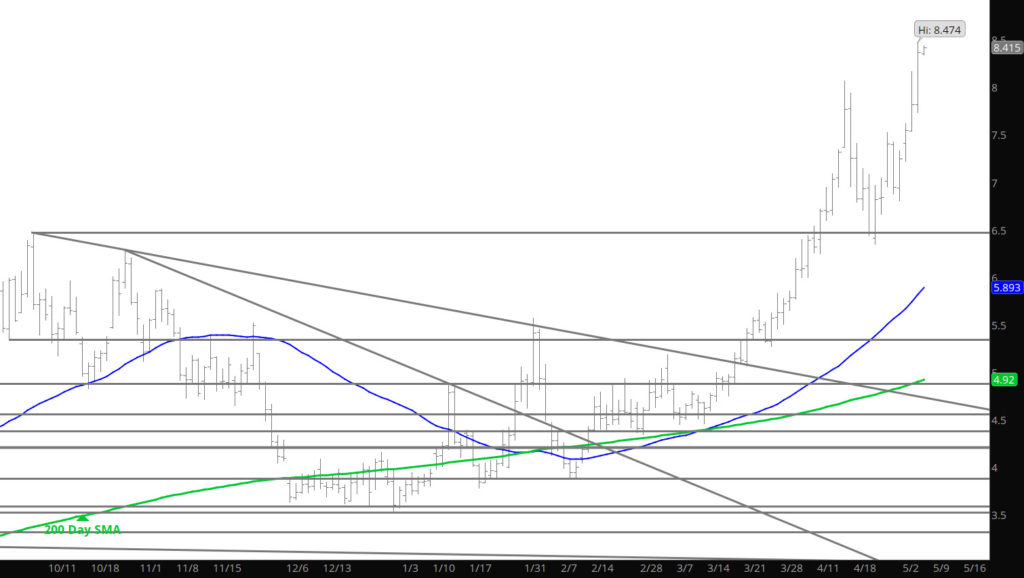
Whether the short–term moving average continue to provide supports they did for prompts April and May, the most important factor is the long series of higher highs and higher lows that define the uptrend (discussed here for over two years) see chart below. Despite a weekly reversal from the April high and a decline from high to low of more than $1.70, prompt gas came nowhere near breaking that pattern. Violation of that April low ($6.345) would suggest a change in character for the gas market. Continue to expect prompt gas and the strips to find support above prior significant lows.
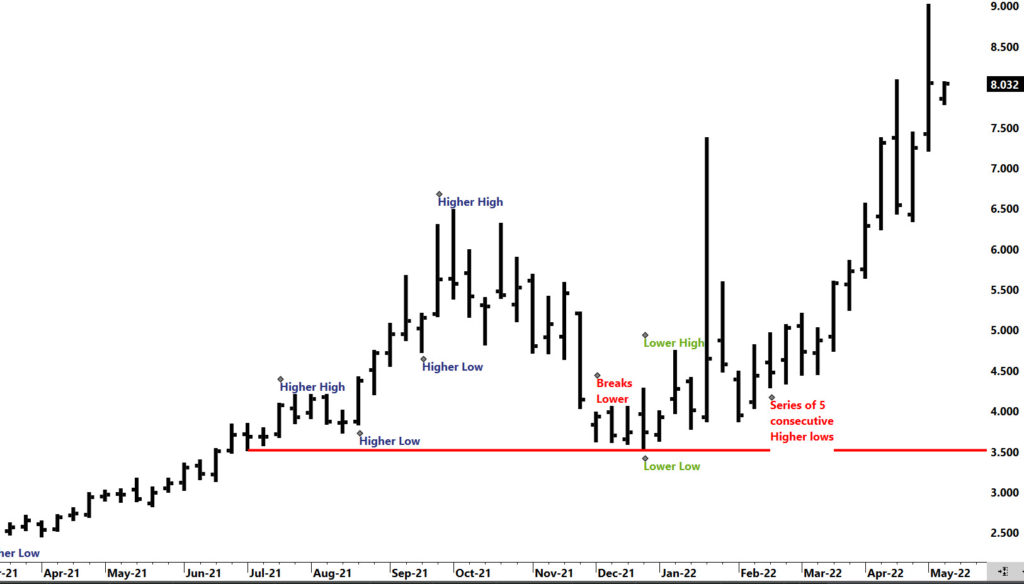
Major Support:, $7.00-$6.855, $6.411-$6.392, $6.247-$6.278, $5.27-$5.199, $5.001, $4.40-$4.26, $4.187
Minor Support: $6.00, $5.063, $5.04, $4.88, $4.60-$4.557
Major Resistance: $8.47-$9.60
Been Here Before
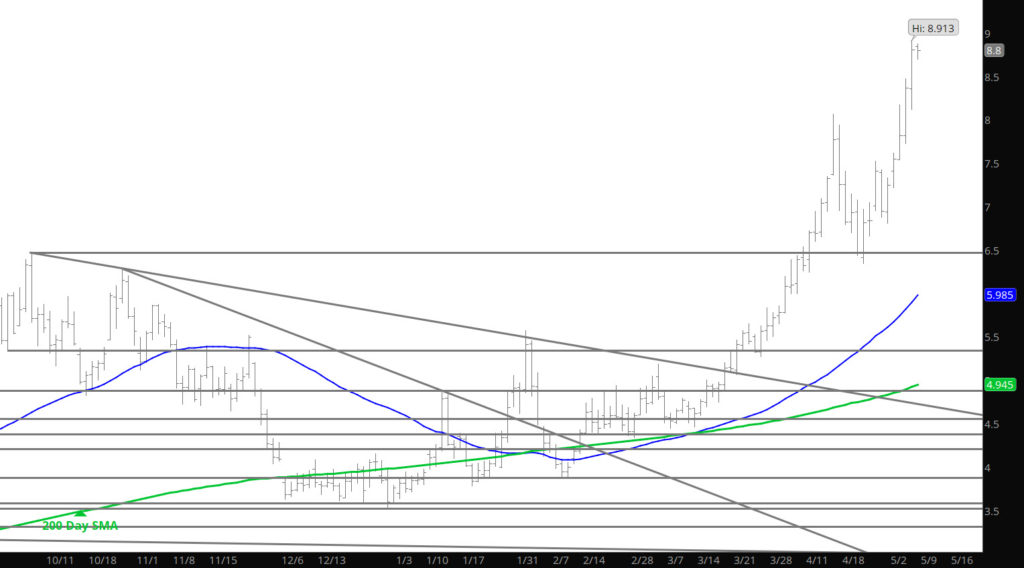
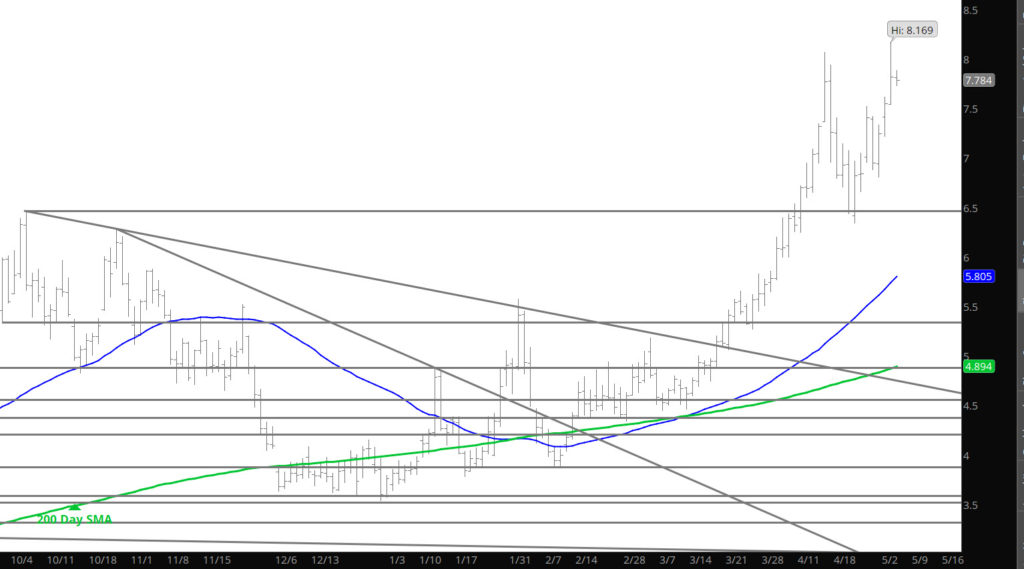
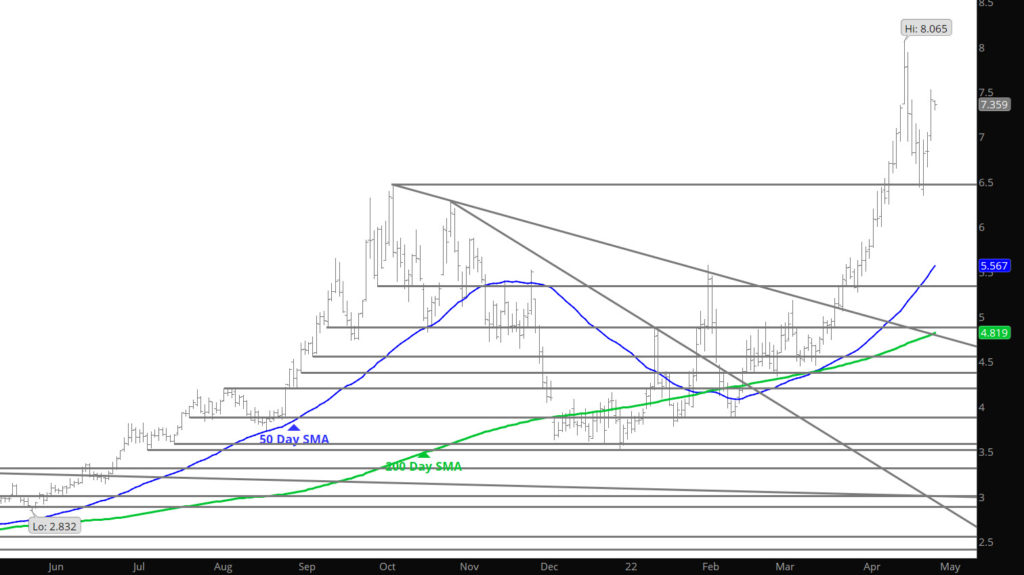
We were in a very similar position a couple of weeks ago, if you remember the chart below:
When prices extend nearly three standard deviations above the 20 WK SMA– it is over cooked. Last time (last month) prices corrected nearly 20% before finding support. Not calling this the high, as prices can continue well beyond technical points — but trust me — there will be a correction. If you are playing this with length — rock and roll, I have retired from playing this market (even on a daily play) until some of the silliness recedes. BTW — I thought that was a bearish storage report — that is why I don’t trade on fundamental data points.
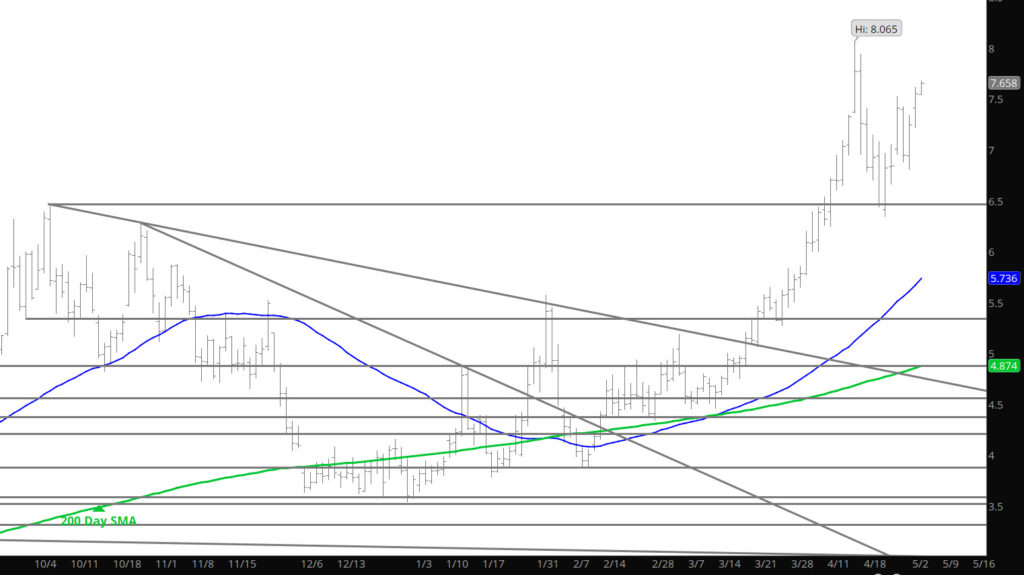
Major Support:, $7.00-$6.855, $6.411-$6.392, $6.247-$6.278, $5.27-$5.199, $5.001, $4.40-$4.26, $4.187
Minor Support: $6.00, $5.063, $5.04, $4.88, $4.60-$4.557
Major Resistance: $8.47-$9.60
This Getting Too Rich
To read The Daily Call you must be a subscriber (Current members sign in here. ) Start your subscription today.
Another Reversal After Clearing $8.00
To read The Daily Call you must be a subscriber (Current members sign in here. ) Start your subscription today.
Rally Closes Above Resistance
To read The Daily Call you must be a subscriber (Current members sign in here. ) Start your subscription today.
Trend Continues With Strong Expiration – Weakness For a Day
To read The Daily Call you must be a subscriber (Current members sign in here. ) Start your subscription today.
Similar Sunday Night Routine
To read The Daily Call you must be a subscriber (Current members sign in here. ) Start your subscription today.
Starts Similar to March
To read The Daily Call you must be a subscriber (Current members sign in here. ) Start your subscription today.
March or April
To read The Daily Call you must be a subscriber (Current members sign in here. ) Start your subscription today.