To read The Daily Call you must be a subscriber (Current members sign in here. ) Start your subscription today.
Daily Call
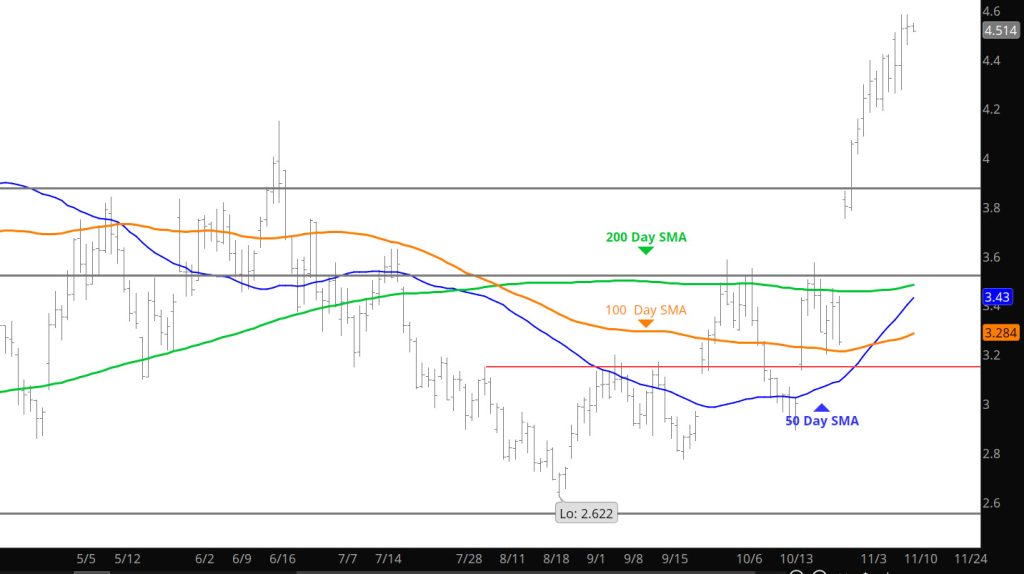
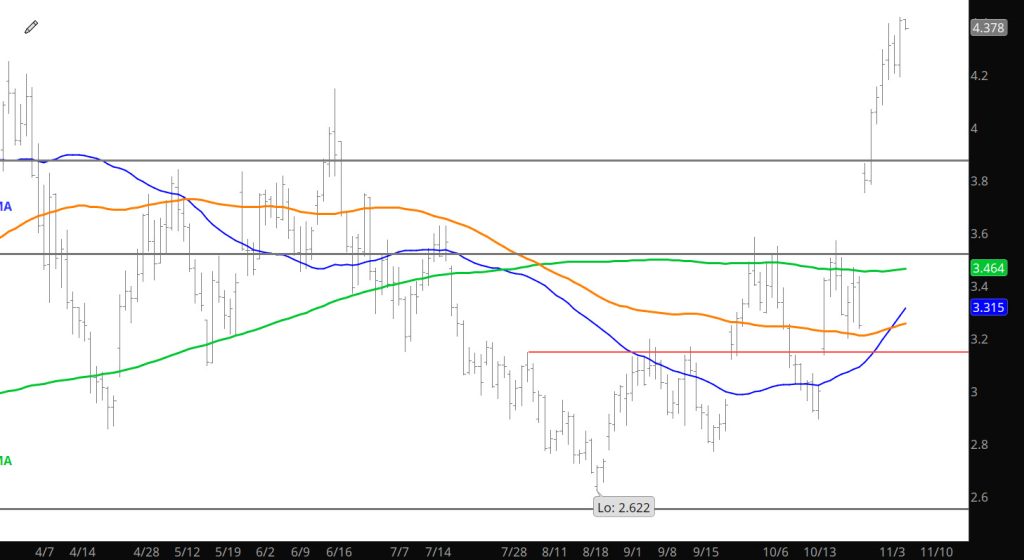
That’s a Solid Test and Rebound
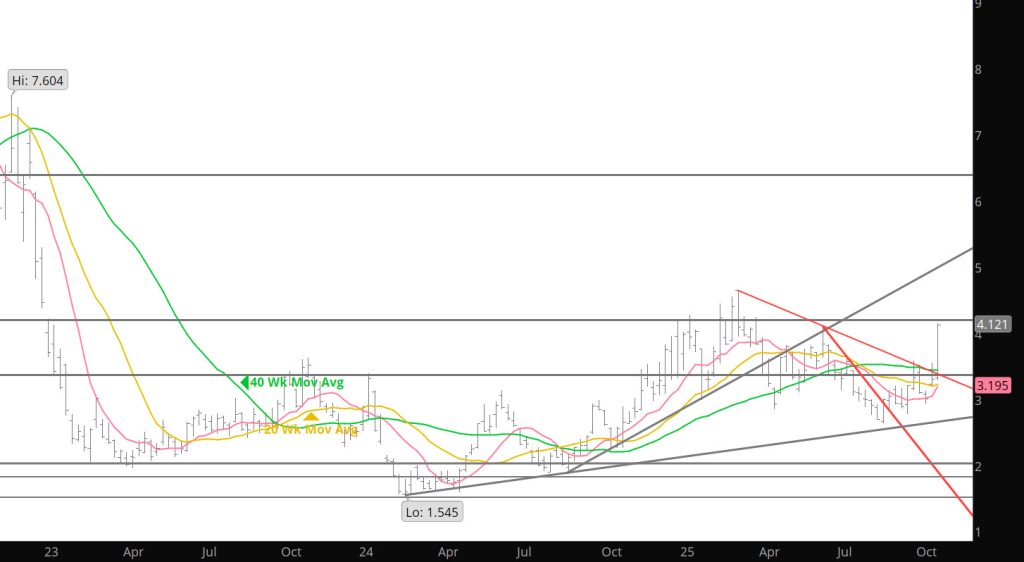
Daily Continuous
Prices seem to want to test the high side of the Nov contract range that has been developing. Positions should hold until existing weather moves on and the storage report is released– watch for a retracement back to the early month lows ($4.20-$4.00).
Major Support: $4.21-$4.139,$4.122,$4.055,
Minor Support : $3.942, $3.75,$3.65
Major Resistance: $4.394, $4.461-$4.475, $4.49-$4.55, $4.901,
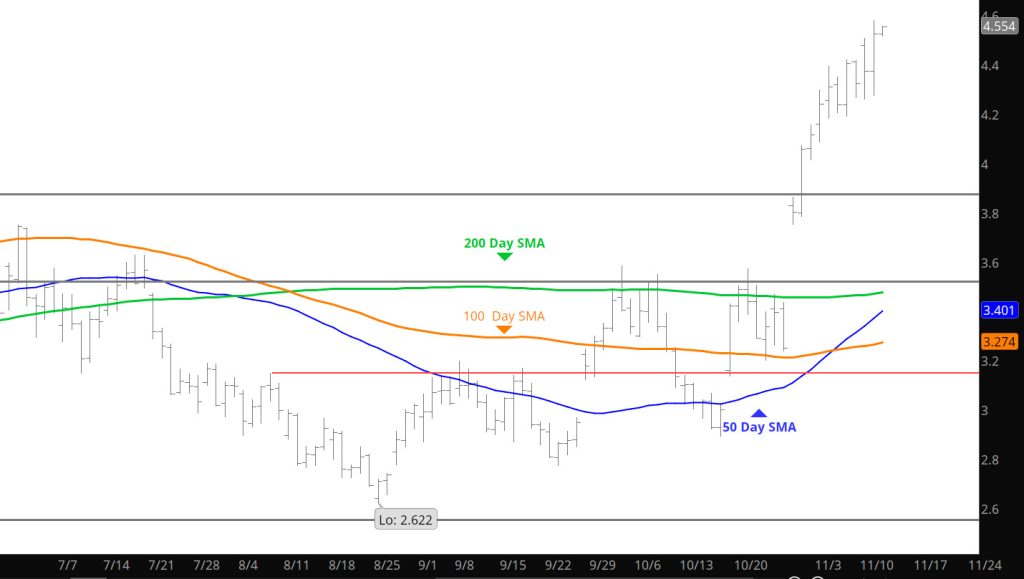
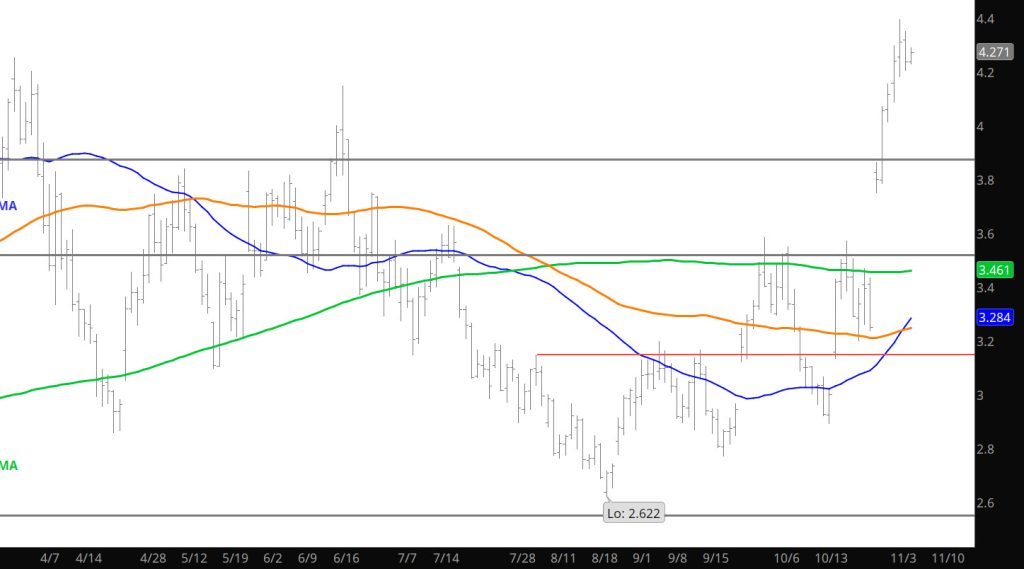
Early Strength Retraces Gains
Daily Continuous
Early strength mentioned in yesterday’s Daily evaporated quickly as the full market opened and forces prices down. Expected, per the Weekly and Daily sections, weakness was expected from the over bought level of the market. Not convinced that the retracement is finished– if you are buying be patient–if you are selling be opportunistic.
Major Support: $4.21-$4.139,$4.122,$4.055,
Minor Support : $3.942, $3.75,$3.65
Major Resistance: $4.394, $4.461-$4.475, $$4.901,
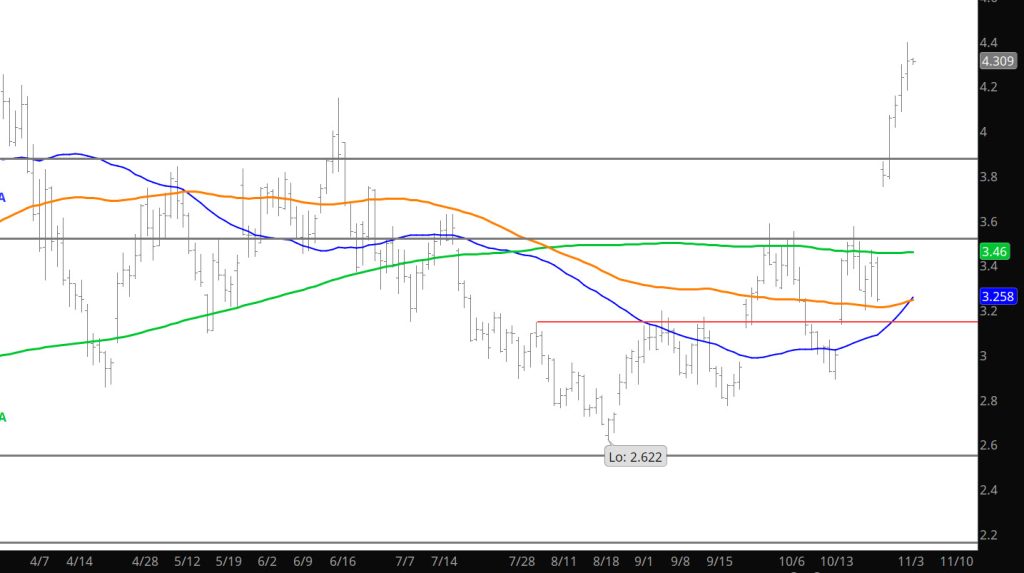
Short Covering Fuels Some of Run
To read The Daily Call you must be a subscriber (Current members sign in here. ) Start your subscription today.
Sunday Trade Starts Strong

To read The Daily Call you must be a subscriber (Current members sign in here. ) Start your subscription today.
Tight Range Continues
To read The Daily Call you must be a subscriber (Current members sign in here. ) Start your subscription today.
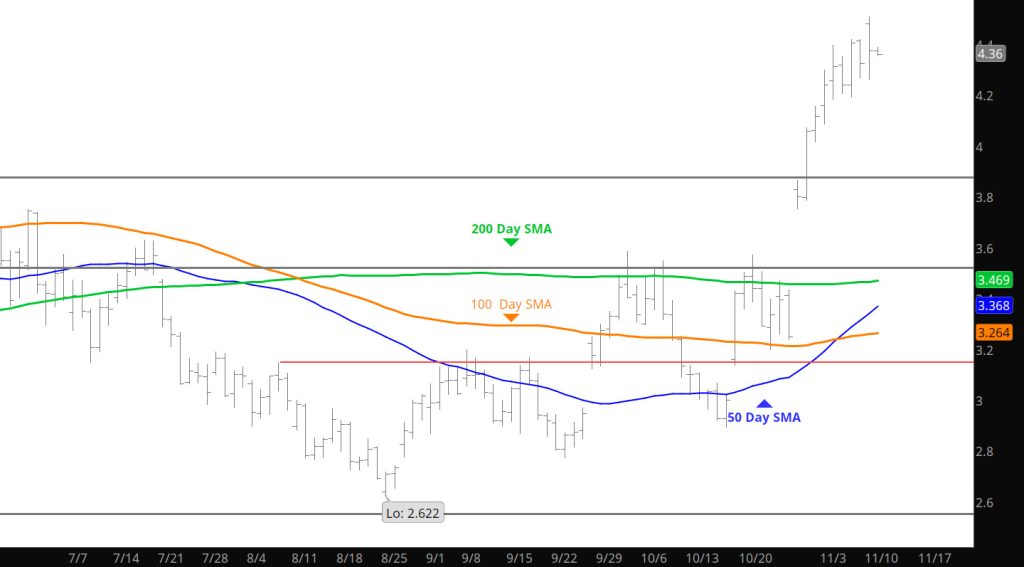
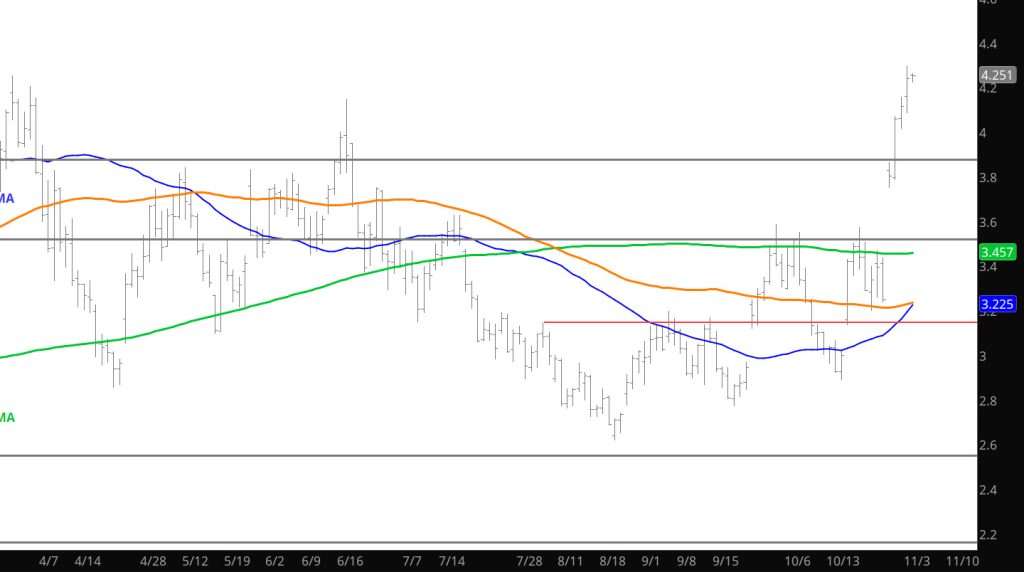
Looks Like Some Calmness With Consolidation
Daily Continuous
Price action is holding firm with some tight daily ranges which signals a lack of commitment from the masses. Today may provide additional information on the the near term bias. While the break above $4.00 provided some income in the last week, the storage report will determine the future action in the next week.
Major Support: $3.06, $3.00-$2.97, $2.843, $2.727, $2.648
Minor Support : $4.16, $4.08, $3.16
Major Resistance: $4.373, $4.461,
Prices Seem to Be Consolidating
To read The Daily Call you must be a subscriber (Current members sign in here. ) Start your subscription today.
Gains Hold and Extended
To read The Daily Call you must be a subscriber (Current members sign in here. ) Start your subscription today.
Is It a Reversal
To read The Daily Call you must be a subscriber (Current members sign in here. ) Start your subscription today.