Weekly Continuous
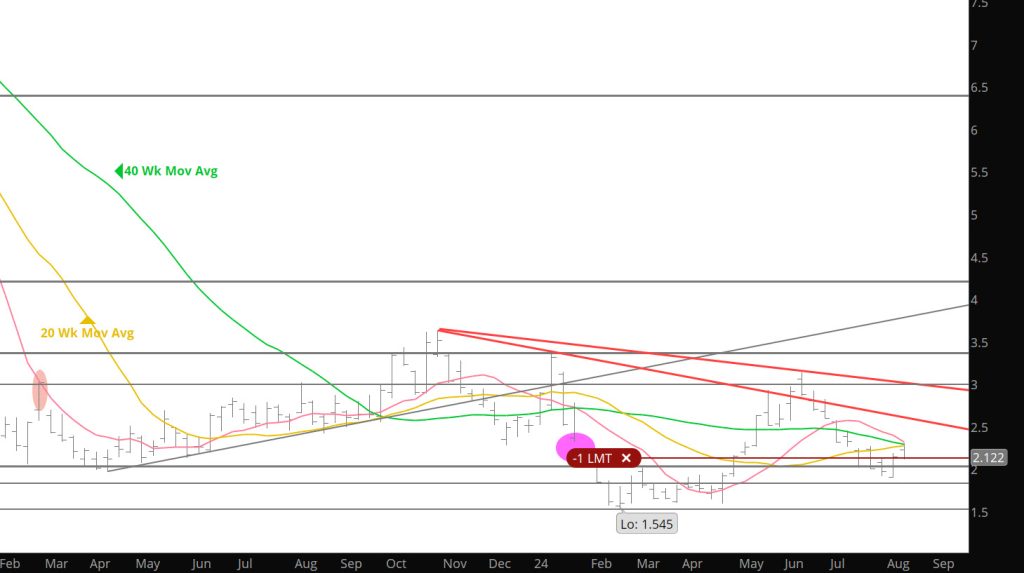
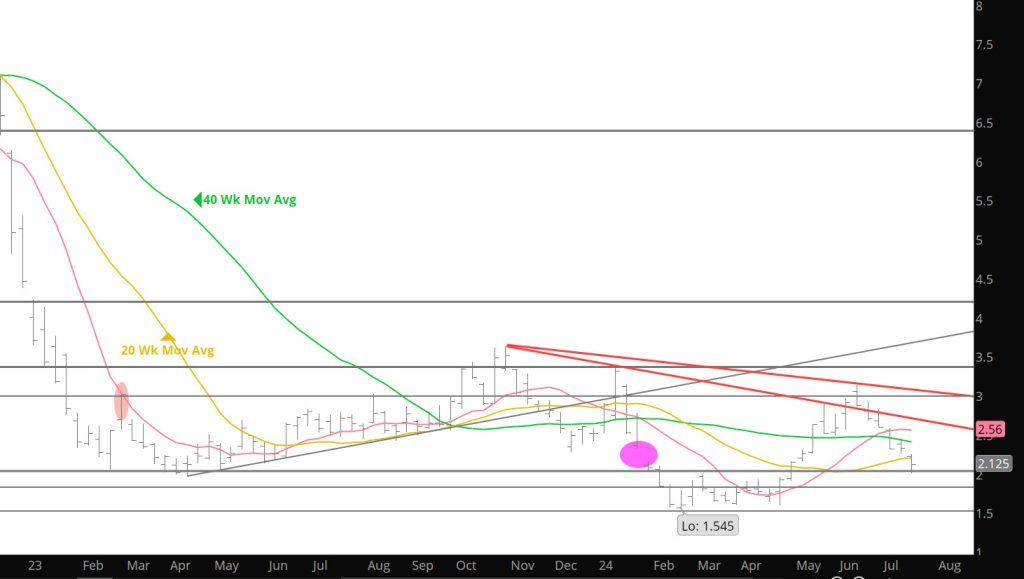
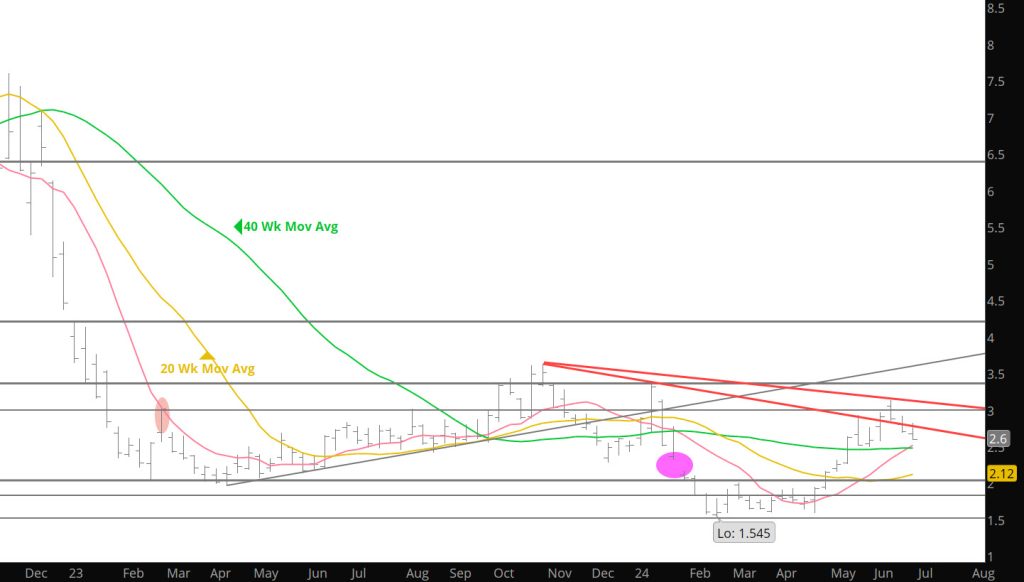
Discussed last week that weakness into the expiration was to be expected and now we have an expiration that the previous monthly expiration’s in 2024 have showed. There is nothing in the market that will prevent the trend from continuing. The more important question will be how much further the declines will occur. Still traveling but will be back after the holiday. n back – to – back weeks prompt September tried and failed to trade through convention resistance between +/- $2.250 and $2.300 and a confluence of declining moving averages…reversing lower after both attempts.
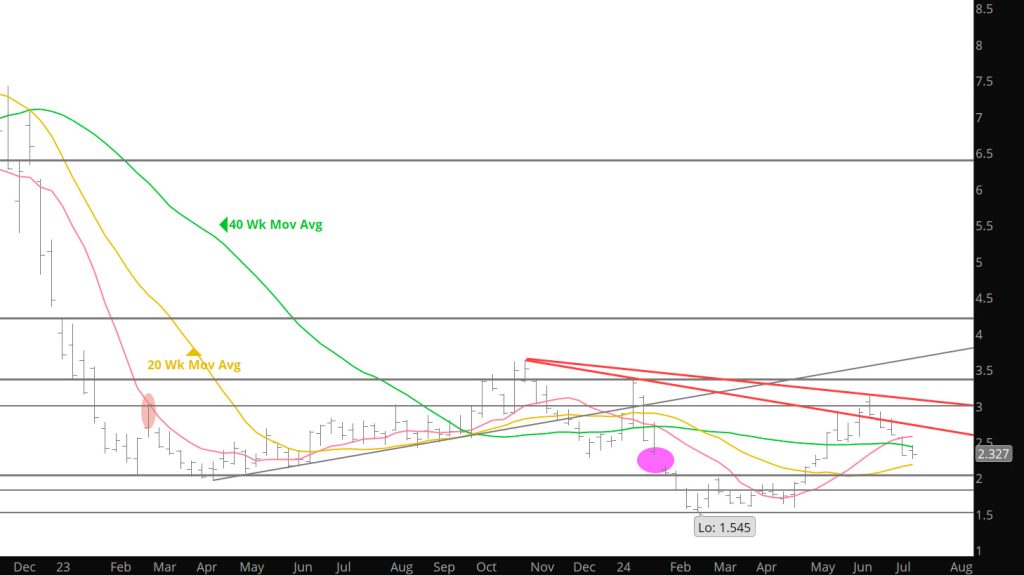
The continuation 10, 20 and 40 weeks SMAs are all declining and currently between$2.238 and $2.274, the high for the week was $2.278. Last week those averages were between $2.262 and $2.324, the high was $2.301. The weekly moving averages of the individual contract months are for the most part substantially higher…although the 10 – week of September is now $2.261.
Based on technical evidence provided by trade of the last two weeks the continuation moving averages are likely to continue to present declining resistance and guide the prompt and successor prompts lower until either the sponsorship develops to overcome the selling that will be coordinated with them or there is an “expiration” gap and weekly close higher…when they will likely act as support. Currently November with .555 premium over the soon to expire prompt, is the leading candidate.
Following the June Q2 high prompt gas closed lower for eight straight weeks (from weeks ending 06/14 through 08/02, For the last seven of those weeks prompt gas traded through the previous week’s low. A $.445 rally…less than a technically normal 38.2% Fibonacci retracement (the rally was 34.1%), that ended with a reversal from what amounts to first weekly resistance (the confluence of moving averages) is not technically constructive.
The twin weekly failures…both closing not far from their respective weekly lows, does not bode well for the near term future of about to expire September or prompt – in – waiting October which is currently awarded .158 premium.
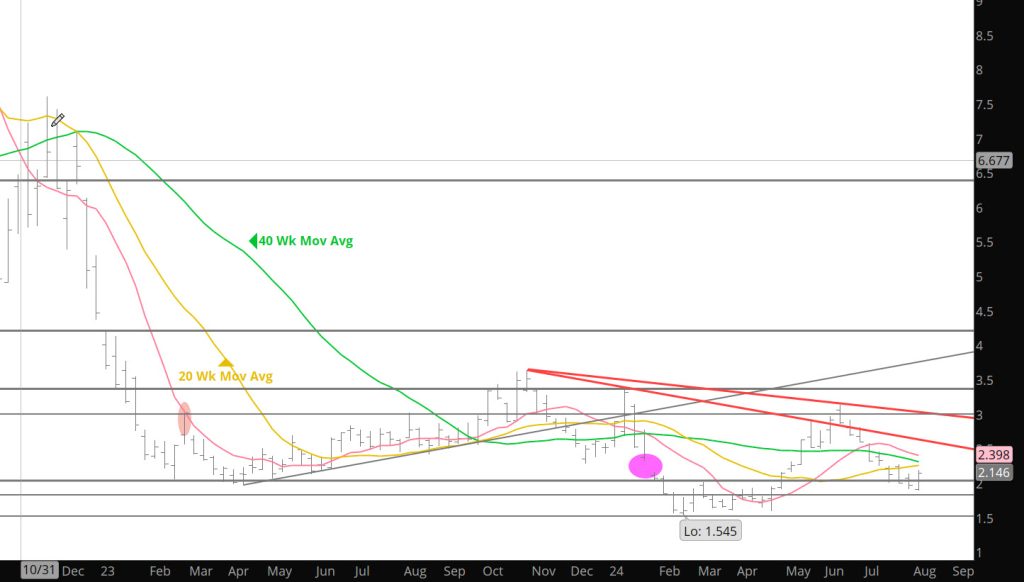
2 b: A retest of the zone of support between $1.918 (the high of the high weekly close during March) the July low, $1.856 and the remaining sliver of the April 29th “expiration gap, $1.848 – $1.856…which is also the upper boundary of an eleven week trading range constructed between mid – February and late April , is suggested.
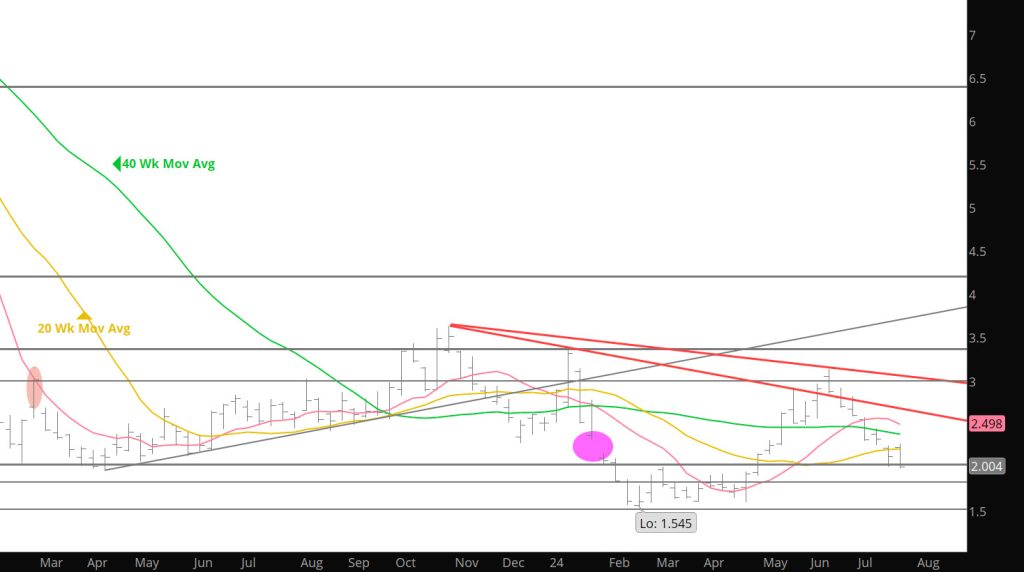
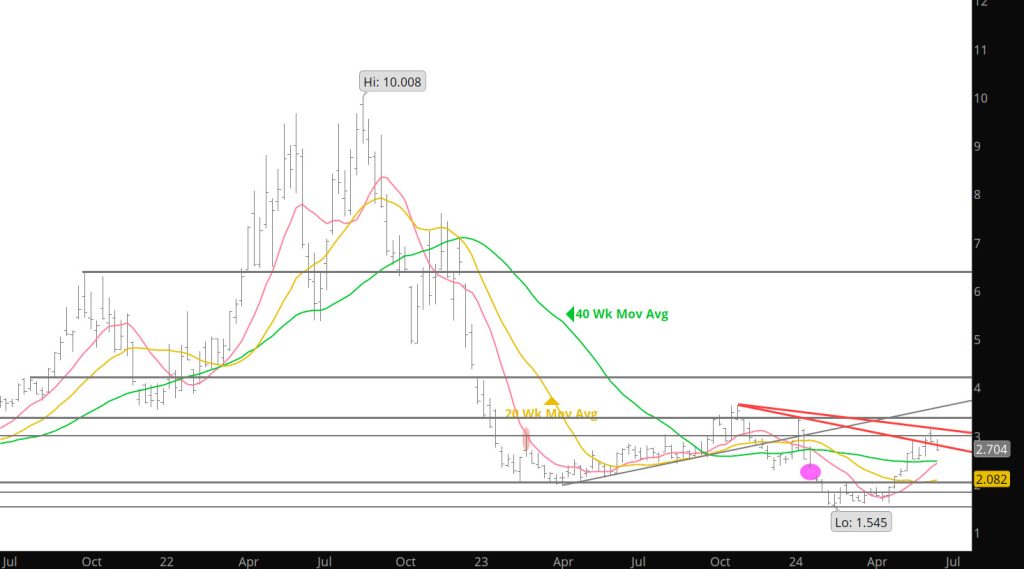
With that said, calendar August is still an “inside” month (within the range traded during July) and with only five trading days remaining ended the past week very close to where prompt September opened on August 1st ($2.046). From 2007 through 2017 the July lows were violated during August in ten of eleven years but have been only once during the last four years.
We are in the crux of that historically consistent price negative period (08/15 – 09/15). The twenty – year average of declines from “Q2” highs to “Q3” lows is 31%, the ten – year average is 25.9%, five years is 24.4%. Since the June 11th Q2 high prompt gas has already traded 41.3% lower. Perhaps the lion’s share of the seasonal weakness has already been discounted, but prompt gas has two other potential price negative tendencies to deal with.
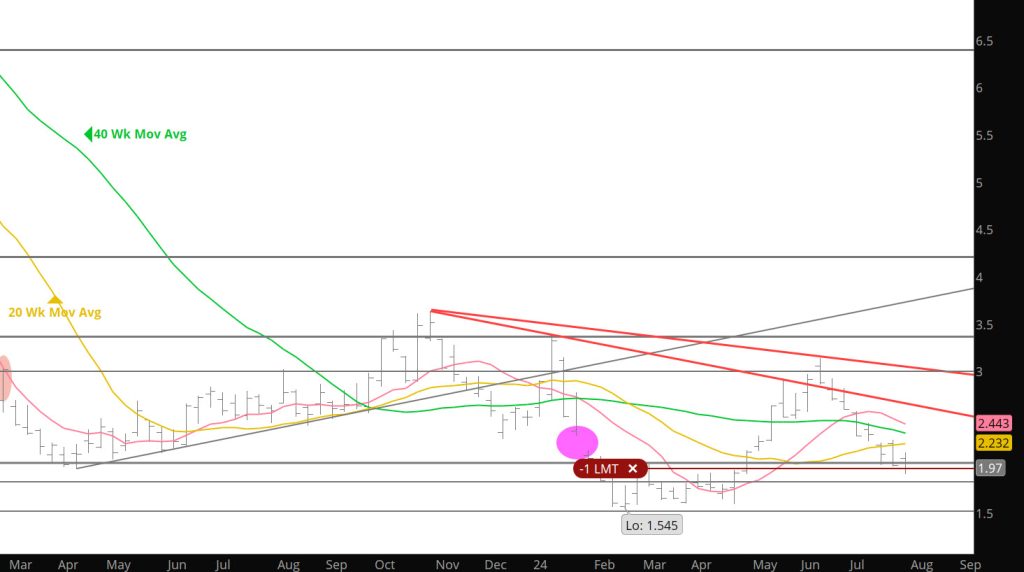
Major Support:, $1.848, $1.52-$1.511, $1.481, $1.312
Minor Support : $2.00, $1.967- $1.94
Major Resistance:$2.18, $2.25-$2.310, $2.39, $2.44-$$2.502, $2.618, $3.00, $3.16