To read The Daily Call you must be a subscriber (Current members sign in here. ) Start your subscription today.
Category: Weekly Detail
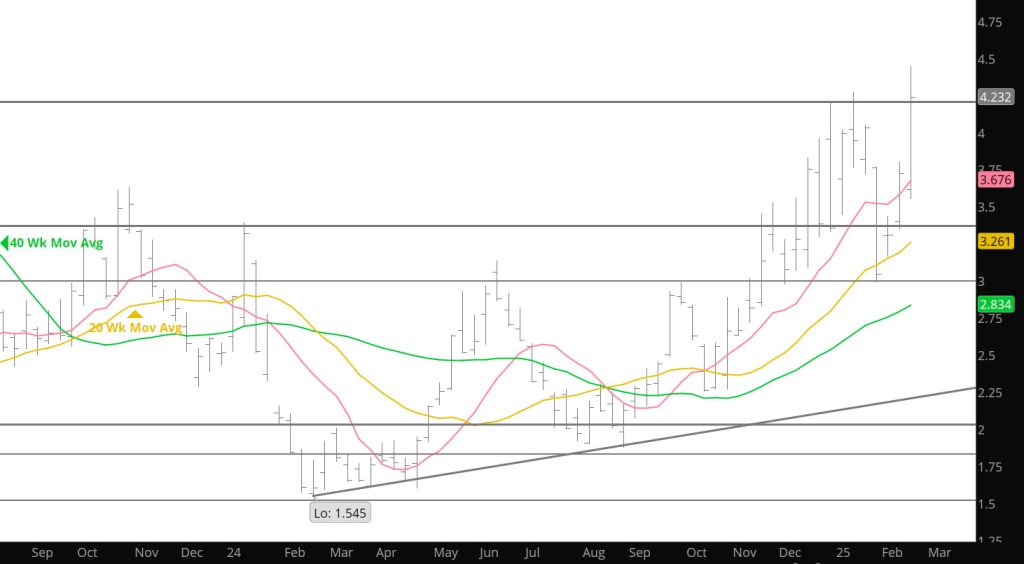
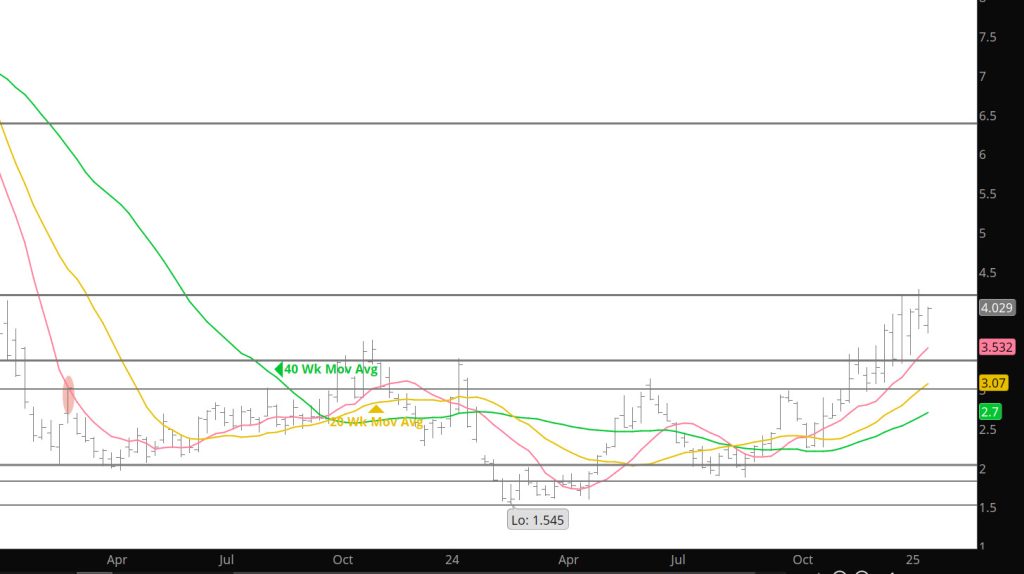
Interesting Battle On Highs
Weekly Continuous
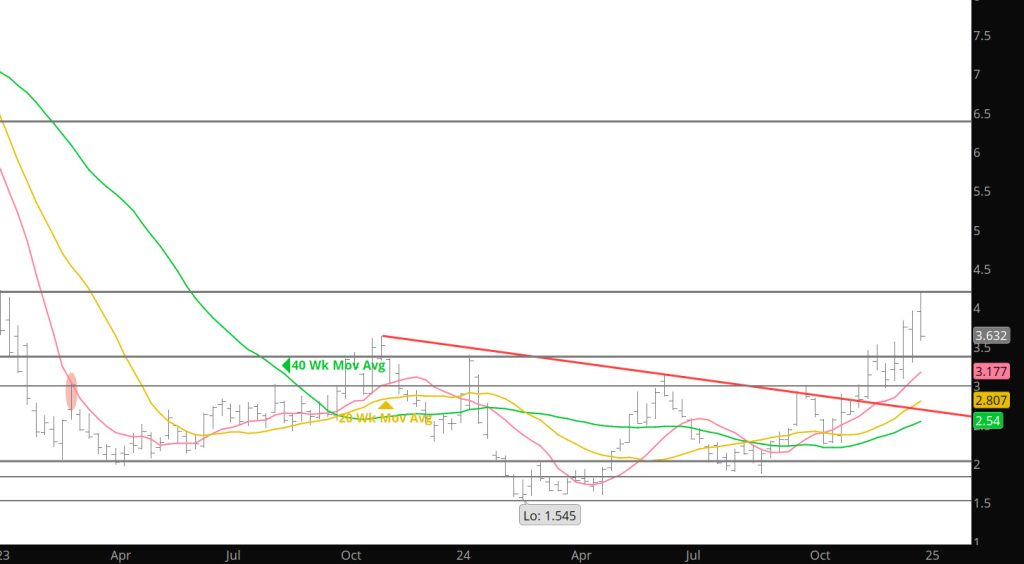
Spoke repeatedly last week about the lack of a higher high for the March contract and the potential impact on the price run of late. Interestingly enough though, was the market closed on the highs of the Week (see chart above). In order to trade a higher high in Feb– the market will need to trade above the Jan high, and since 2009 the calendar January has been exceeded during February twice, 2014 and 2021. In the former the February high ($6.493) was not exceeded until January ’22. The 2021 February high ($3.316) was the high until the following June.
All the technical factors suggest that March will remain “inside” the range traded during January pending a retest of support presented by the December/January lows ($2.977 – $2.990). That said, the sponsorship that propelled March to an $.80/dt rally from the calendar January ending low was surprising.
On Thursday, more than a million contracts changed hands in the natural gas market with the prompt posting a daily gain of only $.063. The 50 – day SMA of volume is 600,638. A principle of technical analysis is that result must reflect effort…in my view it did not.
Over the history of natural gas trading there have not been very many days that volume was a million contracts or more, with 02/13/25 was the ninth time. All of the first eight either preceded or coincided with at least a moderately significant event. Should you be interested in the others send me an email and I will reply. It is also relatively rare for a volume spike to occur with natural gas in a definable range…and ever rarer that an increase in open interest accompanied the volume spike. A guess is that buyers were falling all over themselves to secure supplies when the collapse into and following February expiration was not extended…I think those outlooks will be corrected in the coming few days. Continue to expect the March contract closing the remainder of the gap left on 02/03 ($3. 118 – $3.161).
Major Support:,$2.727-$2.784, $2.648, $2.39, $2.35, $2.112,
Minor Support : $3.34, $3.167, $3.00-$2.95, $2.914, $1.856,$1.89-$1.856
Major Resistance: $3.829, $3.92, $4.00, $4.201, $4.378-$4.394, $4.461,
Intermediate Support Holds
To read The Daily Call you must be a subscriber (Current members sign in here. ) Start your subscription today.
Temps and Storage Allow Weekly Close at $4.00
To read The Daily Call you must be a subscriber (Current members sign in here. ) Start your subscription today.
Another Failure at Resistance With Divergences
To read The Daily Call you must be a subscriber (Current members sign in here. ) Start your subscription today.
Higher Weekly Close
To read The Daily Call you must be a subscriber (Current members sign in here. ) Start your subscription today.
Price Action Conforms to Precedent
To read The Daily Call you must be a subscriber (Current members sign in here. ) Start your subscription today.
Welcome 2025
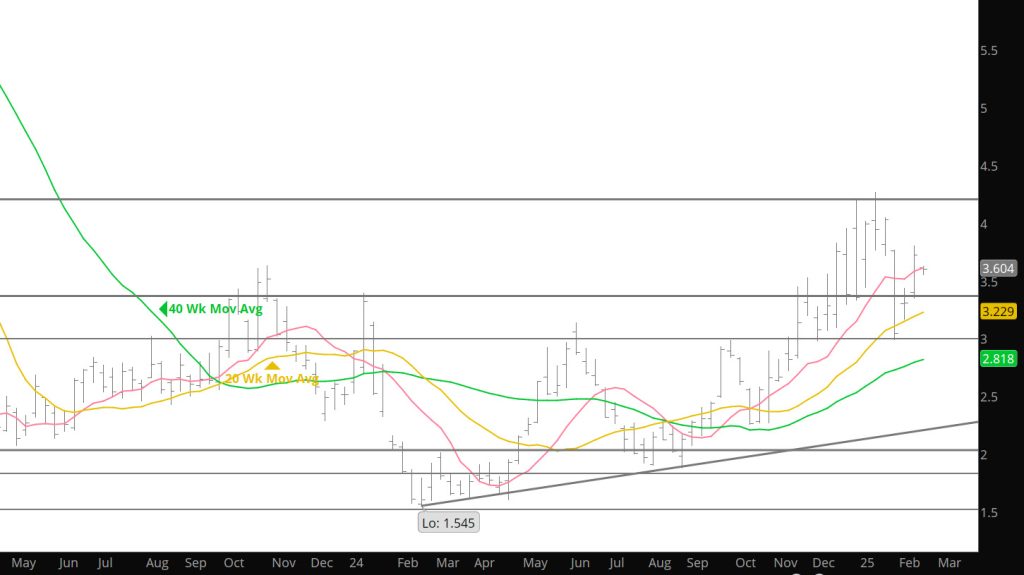
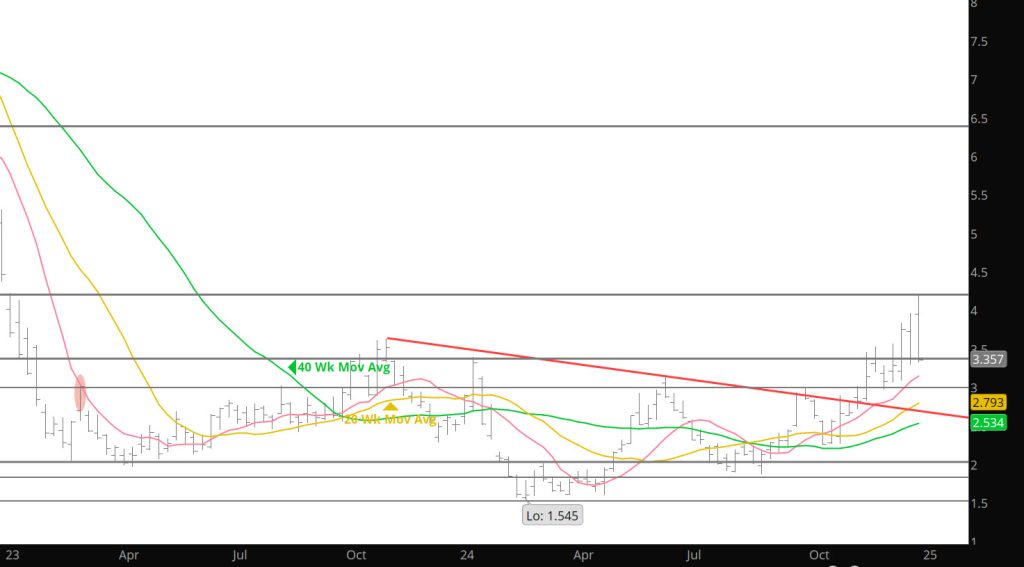
Weekly Continuous
I mentioned in the Daily last week that I was going to quote a wonderful historical analyst (Larry Marshall) who has been following the gas market as long as I have. Here are some of the highlights of his thoughts……
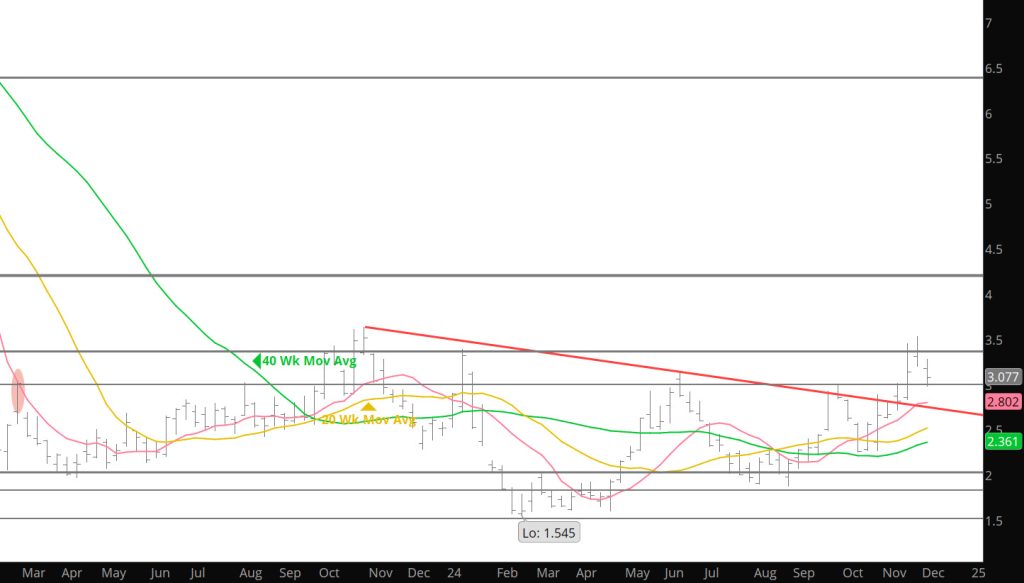
Sometime in the late ‘90s I noticed a tendency of consistent price change at the beginning of each calendar year…almost without exception. Because of the consistency of the tendency and disproportional importance relative to the other eleven calendar months I came to call it the January Phenomenon. Each year about this time I write a summary of those year ending/beginning events…the following is not a lot different than more than twenty – five or so (I lose count) that preceded it.
Almost since the beginning of recorded time (which in natural gas trading for convenience begins in December ’91 – January ’92), late December/early January highs or lows have consistently been more significant going forward into each New Year than the endings/beginnings of other calendar months.
To summarize the 33 years ending since 1991 – 92:
Twenty three of the thirty – three have begun with a gap (although a couple of times the gap occurred during the last or next to last trading day of December).
At the end of ‘23/beginning of ’24 there were two gaps. The first, on 12/28 was an expiration gap…February was offered at a discount to January ($2.536 v $2.621). The second was on the first trading day of the year. Both were quickly closed.
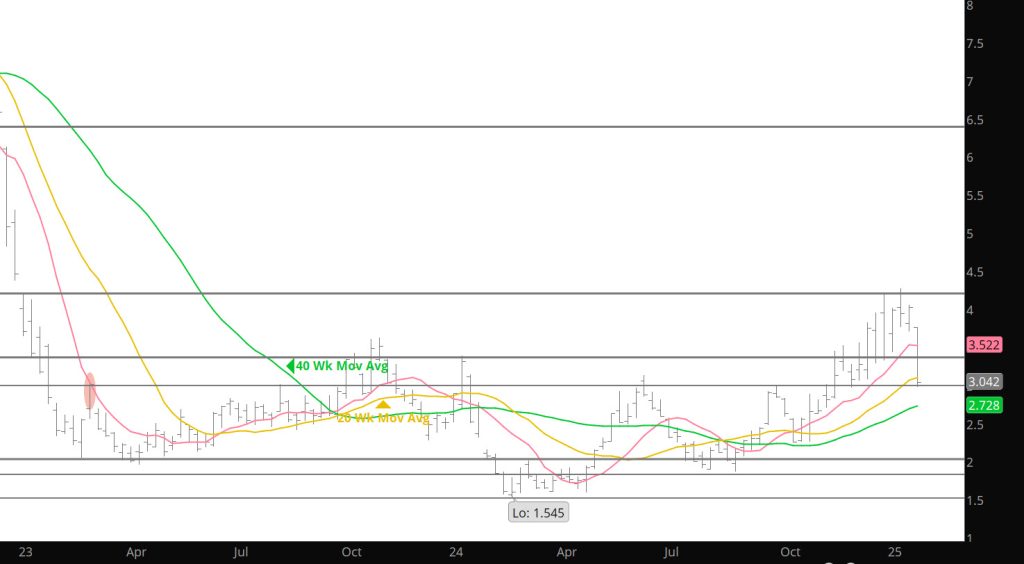
Eight times (five of which began with a gap) the high of the year traded during January, most often during the first week.
Seven times (five of which began with a gap) the low of the year traded during January, most often during the first week.
In the other seventeen years (now 18), thirteen of which began with a gap, either the high of low for January (and in several cases neither) would not be violated for a period of months but once either was, it was consequential…setting the direction of gas prices for an extended period.
The January ’23 low traded on 01/31 at $2.037. That low was violated on 02/01. Prompt gas traded lower until late March, falling another 27%.
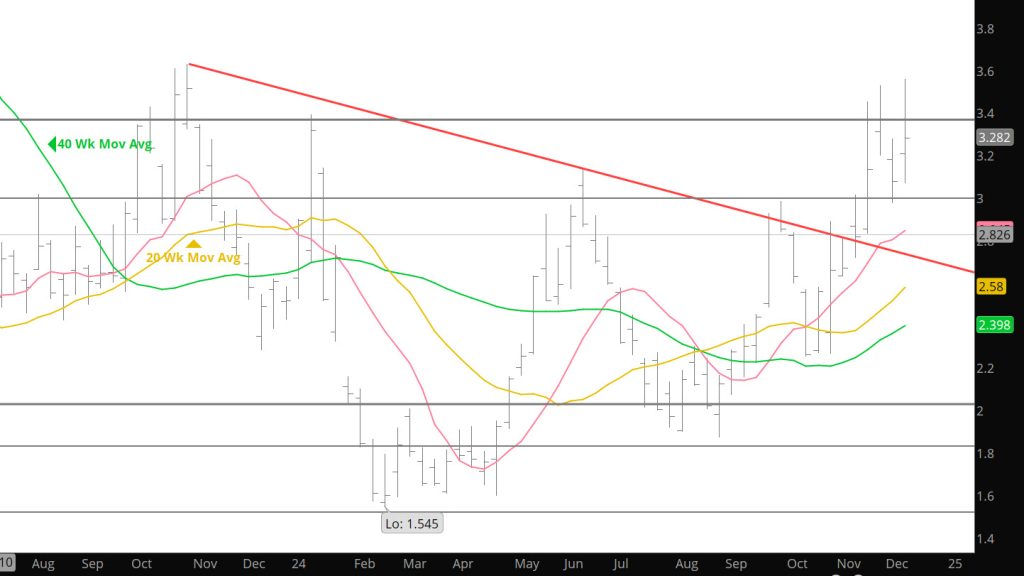
During the six years beginning in ’18 and ending in ’23, the January low was the low of the year twice (’21 and ’22). The January high was the high in ’19. In 2018 the January high was not exceeded until November, in ’20 during August. During ’23 the January high…$3.392 traded on 01/09 (the sixth trading day of the year) was not exceeded until November 21st. Prompt gas has closed above that high twice, the last time was 12/12 at $3.455…the highest daily close since 11/03/23.
All things considered, 2024 conformed pretty closely to the expectation flowing from the January Phenomenon. We are not sure what the 2025 January Phenomenon will provide but I do find it interesting that a gap has already traded on the 27th (last Monday) meeting the historical norm. That gap remains open and should be considered as support.
Major Support:,$2.727-$2.784, $2.648, $2.39, $2.35, $2.112,
Minor Support : $3.39-$3.31, $3.167, $3.00-$2.95, $2.914, $1.856,$1.89-$1.856
Major Resistance: $3.631-$3.681, $3.829, $3.92, $4.00
Lack of Commitment
To read The Daily Call you must be a subscriber (Current members sign in here. ) Start your subscription today.
Back Into the Range
To read The Daily Call you must be a subscriber (Current members sign in here. ) Start your subscription today.