Does It Build or Consolidate

Weekly Continuation

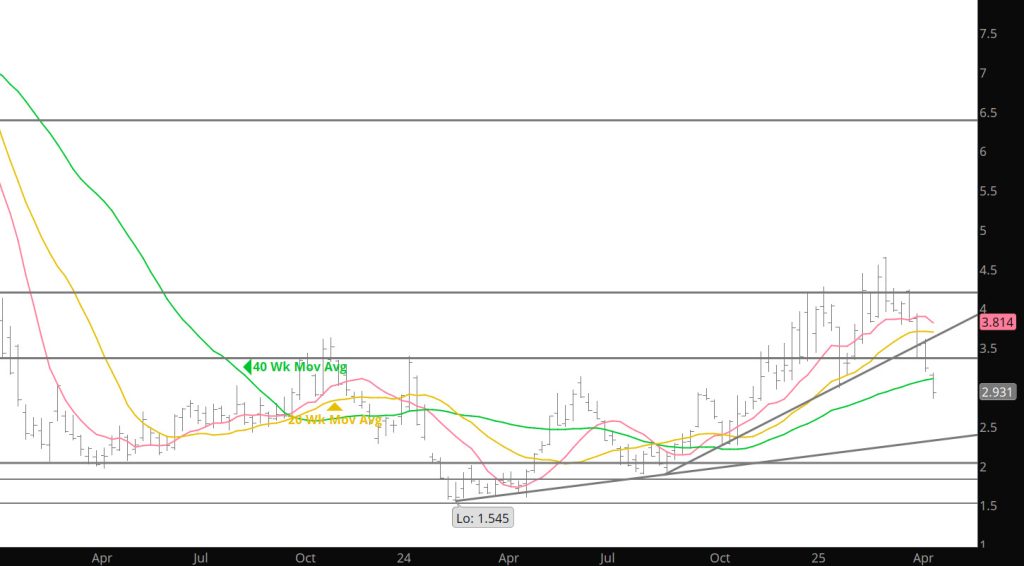
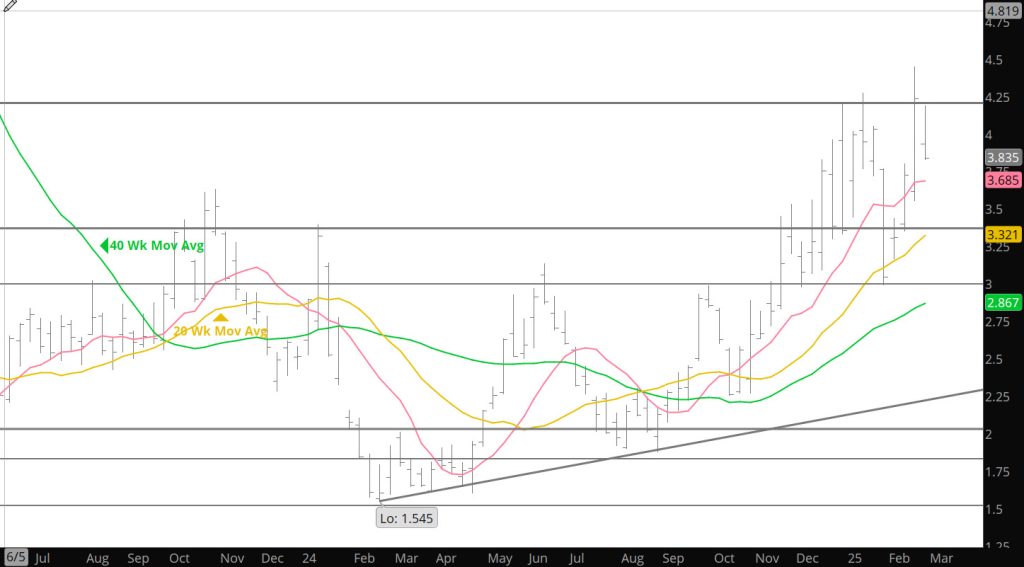
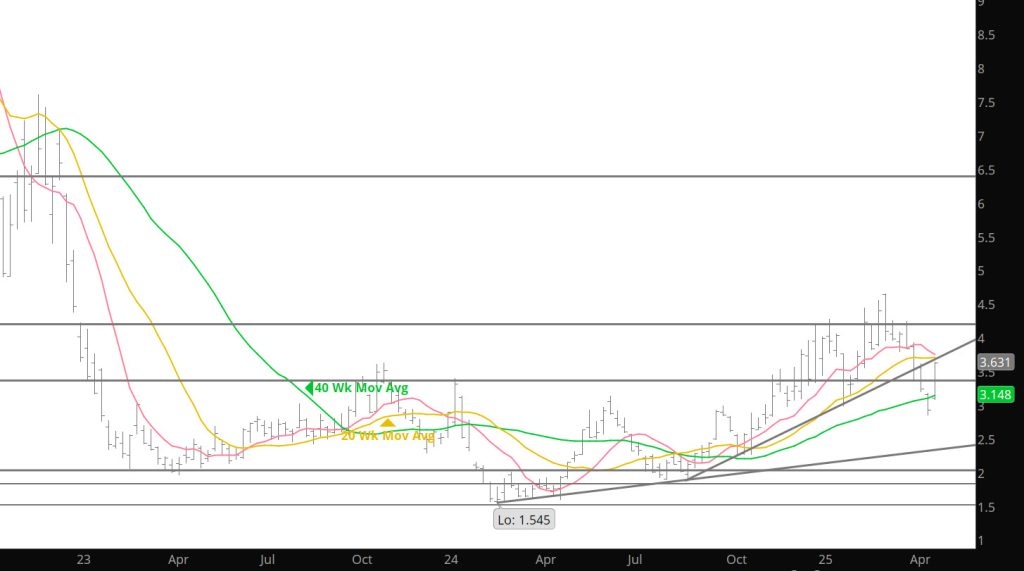
Last week’s rally was not among the things was not my immediate expectation. My view was that new prompt May would forfeit its premium and prompt gas offered lower to test rising trend line support and that technical “damage” done by the precipitous decline during calendar April (from a high on 04/03 at $4.203 to a 4/24 low at $2.858) including a weekly close below the December and January lows ($2.977 – $2.990) would render a significant recovery problematic at best.

The caveat was that in addition to vulnerability flowing from the persistent liquidation of open interest, prompt gas was severely short – term oversold and was two standard deviations below the 20 – weeks SMA for the first time in more than a year. As it worked out those conditions trumped the downside momentum that had built with six of seven lower weekly closes since the March high (the only exception was week ending 03/28 when new prompt May gained $.041). The weekly gain was the second largest for a prompt contract in more than a year ($.518 v $.565 for week ending 03/07) as June traded through layers of defined resistance as handily as it had violated similar levels of support.

Volatility…which can be a hedgers best friend or worst nightmare, increased this week.

Given the elevated level of volatility and this week’s range traded of $.814 (including the gap) it would be reasonable to expect increased volume. That did not happen. Average daily volume fell more than 25,000 contracts and the lowest of the week accompanied Friday’s .151 gain and strong close. Open interest did increase for the first time in four weeks but only modestly…+/- 10,000 contracts. Those are not the characteristics of a sustainable rally.

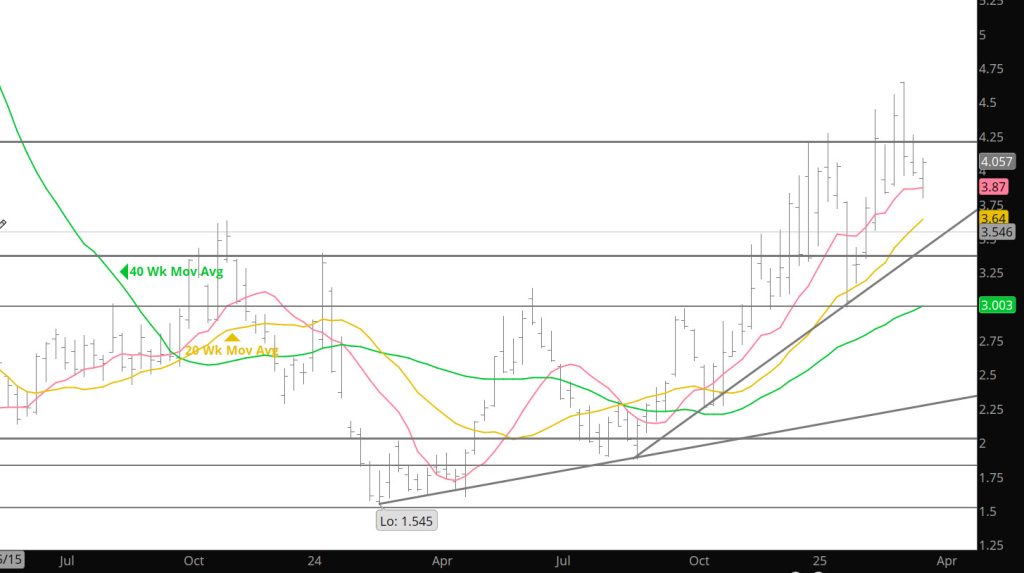
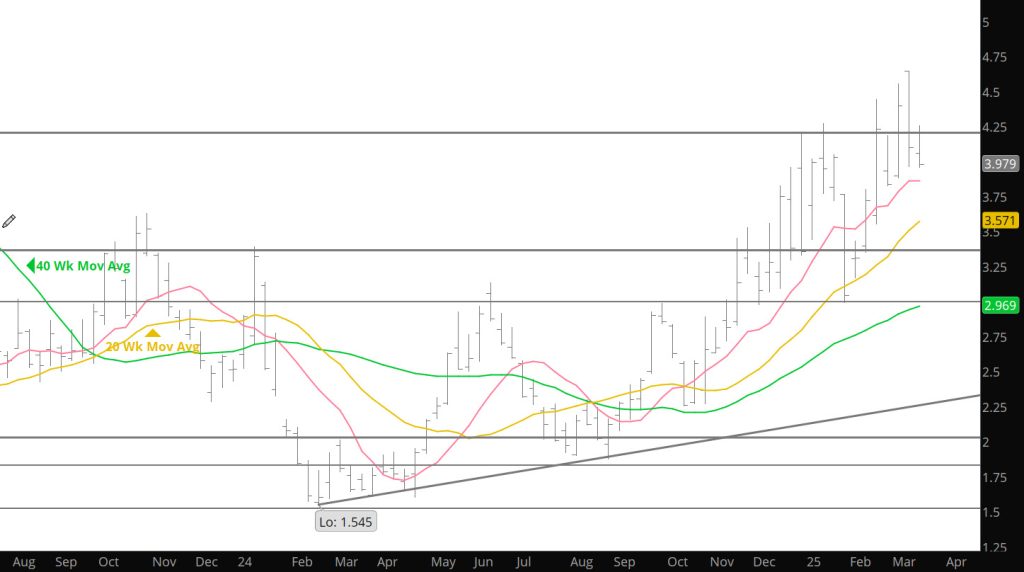
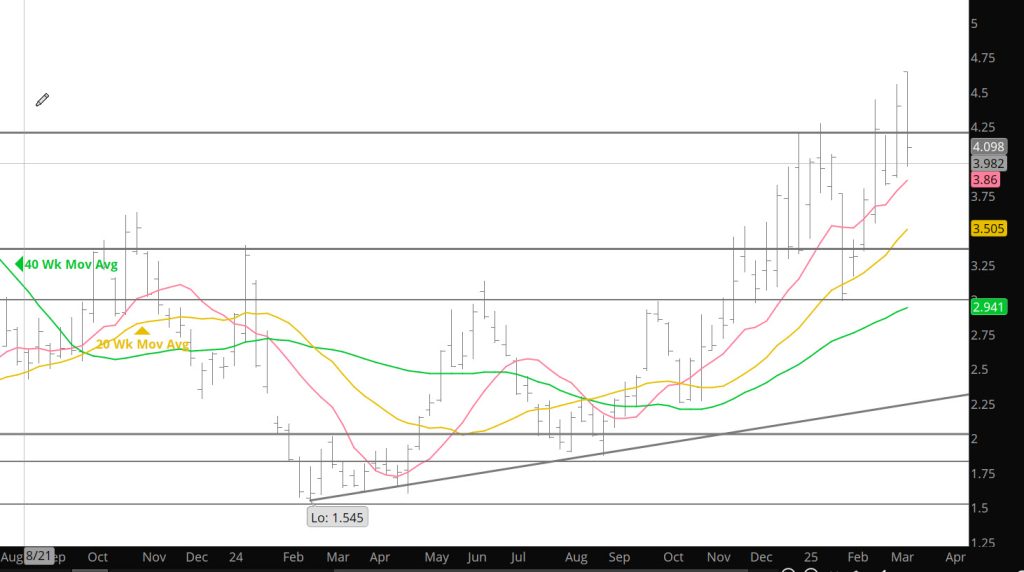
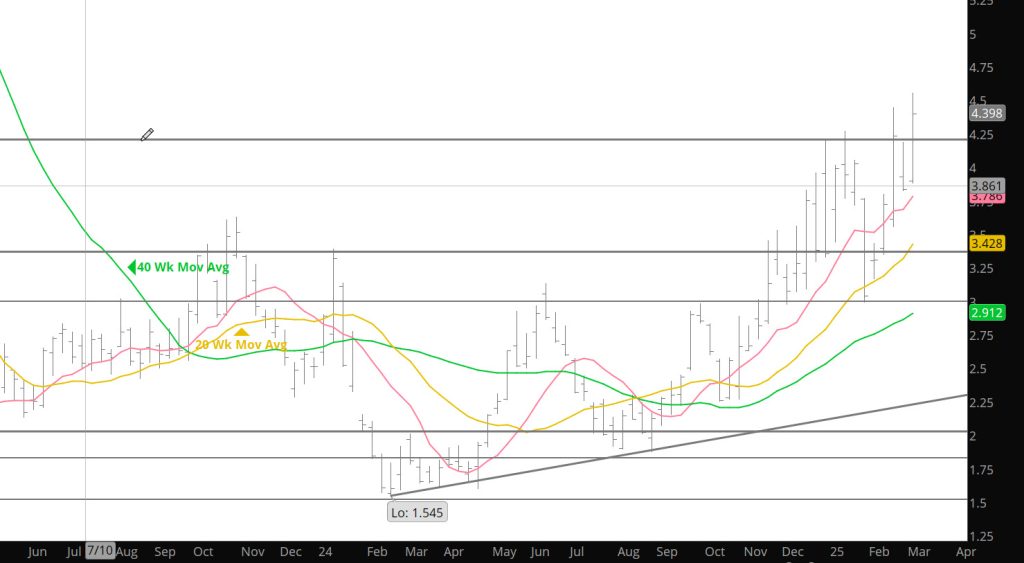
The rapidity and magnitude of this week’s gain left little definable support, June’s April low ($3.007) and the calendar April low and the low of week ending 05/02 ($2.858 – $2.859), but there is a ton of identifiable resistance including the 20 – week SMA…which as of late prompt gas seems to swing to extremes around. The 20 – week is currently $3.732. A few weeks ago, the solution for dealing with a persistent elevated level of volatility (the weekly ATR is $.587 and has been $.50/dt/week or higher since the beginning of ‘25/. In early May ‘24 it was $.306),

Major Support: $2.97, $2.727, $2.648,
Minor Support :
Major Resistance: $3.628, $3.86, $4.168, $4.461, $4.501, $4.551, $4.746-$4.75, $5.03

Seasonal Tendencies Remain Intact

Weekly Continuation

After declining for the fourth consecutive week, the gas market is suddenly at least short – term oversold…both the daily RSI and MACD finished the week in their historical EXTREME zones and the weekly RSI is not far away. In addition, prompt gas which just seven weeks ago was extended nearly three standard deviations above its 20 – weeks SMA closed on Friday two standard deviations BELOW that important moving average. The last time prompt gas was there was during February ’24 during the construction of a multi – year low, from which prompt gas more than tripled.

This is hardly the first time that veterans have seen gas prices fall precipitously from a blow off high…2014 and 2018 are two of the more recent examples. Many times, the comments that “this time is different”, has been referred to here and in the Daily, but this time it does feel a little different to me. If for no other reason, prompt gas remains above clearly defined rising trend lines on the weekly and monthly charts. Those are the same two trend lines suggested here in late January/early February would be tested as gas traded down to a traditional late Q1/early Q2 low. While that did not happen, they are still there to be tested…and until they are decisively violated the uptrend from the above referenced multi – year low is still intact.

To read The Daily Call you must be a subscriber (Current members sign in here. ) Start your subscription today.

Holiday Shortened Week – Brings Little News

Weekly Continuous

Due to an Easter celebrations — the Weekly and Daily sections of the website will be short in length. Last week provided little resolve to the previous week’s dilemma regarding bias but it was interesting to watch a lower low each of the trade days (technically a negative bias) but the open interest continued to decline each day (non-supportive of a bearish bias). Discussed here several times that volume is the energy that drives price trends and having declining volume levels last week sends a warning flag. There was not break down in prices but rather what I would characterize as a slow melt. At the end on Thursday (Friday – market was closed) there had been little resolution as to the bias for this upcoming week. The market did seem to hint at testing the $3.168-$3.11 gap in the Daily Continuous, but even if it opens down in the gap on Sunday night — the trend has been over the last few weeks, that what ever direction is established in Sunday night trade — the Monday full trading day reverses. Caution is advised.

Major Support: $3.336, $3.16-$3.11-$2.97, $2.727, $2.648,
Minor Support :
Major Resistance: $3.628, $3.86, $4.168, $4.461, $4.501, $4.551, $4.746-$4.75, $5.03

Not So Fast Bulls and Bears

Weekly Continuation

Spoke last week about the expectations of a test of support at the zone around $3.68 — well that happened quickly and prices extended into the next support zone in the $3.30s before finding some footing associated with the enormous rally in all the markets (most importantly crude) after the early weakness. Associated with the volatile week was a massive liquidation of open interest, 58,210 contracts on Tuesday alone during the suggesting that there some disappointed longs, which triggered the necessary volume. From there the next area of support mentioned in the Daily was the target between support at $3.250 – $3.300 — the May contract could not fulfill that expectation. After trading as low as $3.336 May reversed higher to close at $3.816 (some would consider a solid reversal). It is not normal technical analysis, but a sudden switch from “risk off” to “risk on” resulting from events unrelated to natural gas was the trigger for the substantial high volume reversal. Crude reversed along with natural gas to trade nearly an $8 range, gold nearly $125, bitcoin nearly $9000 with similar volatile gains in risk assets across the spectrum.

Such events are unpredictable and are usually unwound, but are also often consequential. In the case of gas, the reversal traded with 1,122,556 contracts and further liquidation of 44,450 contracts of open interest as participants with short positions were whipsawed out of the previously falling market. Between the two events (the liquidation of long positions on Tuesday and short positions on Wednesday) total open interest was reduced nearly 100,000 contracts and another 30,000 on Thursday. There are not a lot of comparable wholesale liquidations that match those few days.

To read The Daily Call you must be a subscriber (Current members sign in here. ) Start your subscription today.

Crude Market in Decline– Gas Remains Range Bound

Weekly Continuous

Beginning its first full week as prompt May, jumped higher but the attempt to trade further into resistance was frustrated by a previously violated short – term trend line. For the third time in three weeks prompt gas traded a weekly reversal, each of those reversals has been traded with diminishing volume suggesting an increasing “uneasy equilibrium”, as prompt gas consolidates ahead of a range expansion…one way or the other.

Prompt gas has been trading between a pair of high volume lows ($3.554 and $3.742) and a pair of high volume highs ($4.476 and $4.551) One exception of the brief spike to the March high, since mid – February . The zone between the two lows (02/18 & 03/03) is very well defined support that has been tested once…on 03/27 when about to expire April traded the March low, $3.689 and simultaneously completed an expected regression to the 20 – week SMA. This week’s poor close, strongly suggests May will retest that support…and an important trend line on the May chart.

To read The Daily Call you must be a subscriber (Current members sign in here. ) Start your subscription today.

Range Remains

Weekly Continuous

After consecutive poor weekly closes following the price spike to $4.901, April nearly completed the thought of a regression to the continuation 20 – weeks SMA. The expiring prompt traded as low as $3.689 (the value of the 20 week avg was $3.655) before recovering enough to go off the board at $3.861, a little under March ($3.906) but higher than January ($3.644) and February ($3.535). Four calendar ’25 settlements in relatively close proximity suggests that he gas market is adjusting to a higher price level and is/has (or will) come to some kind of uneasy equilibrium. New prompt May followed the expiring prompt lower and tested support at its January high before reversing back through its 50 – day SMA. Well bid into the close May posted a gain for the week, its first since the high weekly close on 03/07 ($4.456).

Characteristically, in a healthy uptrend volume increases as prices push higher. When a correction occurs volume should diminish. As can best be seen, aside from the volume divergence that occurred during the week of the spike high (a higher high with lower volume) that is what has occurred since the January low and periodically before. Particularly the three higher weekly closes following that January low with increasing volume, the “inside” week with a lower close with diminished volume and more volume as prompt April traded to the early March high weekly close. Since then, with lower closes volume for each week has steadily diminished. This week’s lower volume reversal after April lost ground into expiration is an indication that the gas market is not ready to run back toward the highs, but suggests that the foundation is being laid.

To read The Daily Call you must be a subscriber (Current members sign in here. ) Start your subscription today.

New April Closing Low

Weekly Continuous

After consolidating in a daily closing range of about $.20 for five days April violated a slightly rising short term trend line with the highest volume of the week. The low of the week followed but sponsorship at the continuation 50 – days SMA limited further decline. Prompt gas tested, held and recovered from the continuation 50 – day for the third time since 02/18, but the violated trend line limited the recovery and April closed below $4.00 for the first time during March.

For all but an hour or so that the spike to and failure at $4.901 lasted, April has spent its entire tenure as prompt between a high volume low traded on 03/03 ($3.742) and a high volume high traded on 03/04 ($4.551) . The extremes of those two expanded ranges present important support and resistance for the upcoming months) particularly the lower one which now is approximately equal to the 50 – day SMA of soon to expire April gas.

To read The Daily Call you must be a subscriber (Current members sign in here. ) Start your subscription today.

Slight Reversal of Fortune

Weekly Continuous

April gas opened at $4.467 and quickly extended the rally to $4.901 (the highest price paid since 12/28/22) but the sponsorship/volume did not develop to support the higher price and prompt gas reversed lower. After setting a higher high before running out of support, the market quickly reversed and sold off in a quick three day fashion. Unfortunately (for bears) it did not reverse through the previous week’s low, and it lacked a significant volume compared to the previous weeks. Though prices clearly reversed — from a technical standpoint — it can’t be considered a weekly reversal– but it does indicate that the recent strength may be weak in the teeth and further jumps in prices will have significant road blocks between $4.50-$4.90 in the coming months.

The market has been trading in ranges for the last couple of months and perhaps the current market is setting up the new and next range $3.75-$4.90.

To read The Daily Call you must be a subscriber (Current members sign in here. ) Start your subscription today.

Bias Change

Weekly Continuous

Mentioned a few weeks ago to respect the run and constant tests above the $4.00– perhaps the market was changing its bias. All of that respect was under the assumption that prices were going to make a strong test of support at $3.16 and possibly below. Those thoughts left the building with the second largest gain this year…second only to the $.634 gain for week ending 01/10. The “outside” day reversal higher (with the most volume since the day before the February high) was followed by an extension of the rally through that February high for only the seventh time in the last twenty years, but the third time in the last four. April traded to the highest price since 12/30/22 and to a new high weekly close $4.399.

Been discussing the expectation and the divergences looking for the seasonal decline (Q1 low) which is clearly unlikely at this pace. You have to count the two plus weeks decline from the January high ($4.369 – $2.990) that just held the December low ($2.975) as the Q1 low the gas market has traded the Q1 low in January several times in history (in ’21 & ’22 the season low was traded during late December. The last time there was an actual January Q1 low was in ’13). Notwithstanding the dramatically increased likelihood that the “winter” low is in place, divergences, non – confirmations by purely mathematical indicators, are evidence of an underlying weak technical market structure. That which does not mean the market can’t move higher and eventually “cure” those divergences. While not foreclosing that possibility…it is my experience that cure is exceptionally rare without a significant correction in terms of price and time (a correction that lasts two weeks does not meet my expectations.

To read The Daily Call you must be a subscriber (Current members sign in here. ) Start your subscription today.

Near term Support Fails

Weekly Continuation

The historical consistency of declines following rallies to calendar February highs were discussed over the last week particularly 2014 and 2021 (other years described briefly were ’03, ’05 and ’08) that I did not go into. While there were notable similarities between all but ’08, there were also some substantial differences in the degree of weakness that followed. The two most recent examples are illustrative.

In 2014, March gas traded and reversed from its high on 02/24 (similar to March ’25), but the percentage decline to settlement was a little more than twice that of the recent decline. From the February high at $6.493 prompt gas fell to its “Q1” low on 04/02 at $4.221. An erratic Q2 rally peaked on 06/16 at $4.886, significantly below the average of Q2 rallies. Interrupted by several rallies which all peaked at lower highs prompt gas did not print the 2014 low until the last trading day of the year at $2.882.

To read The Daily Call you must be a subscriber (Current members sign in here. ) Start your subscription today.