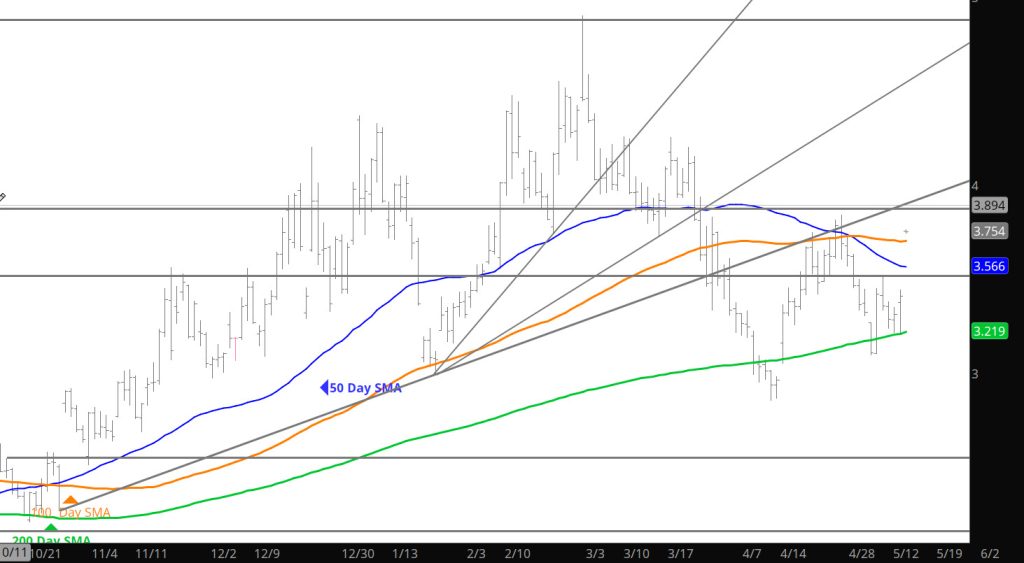
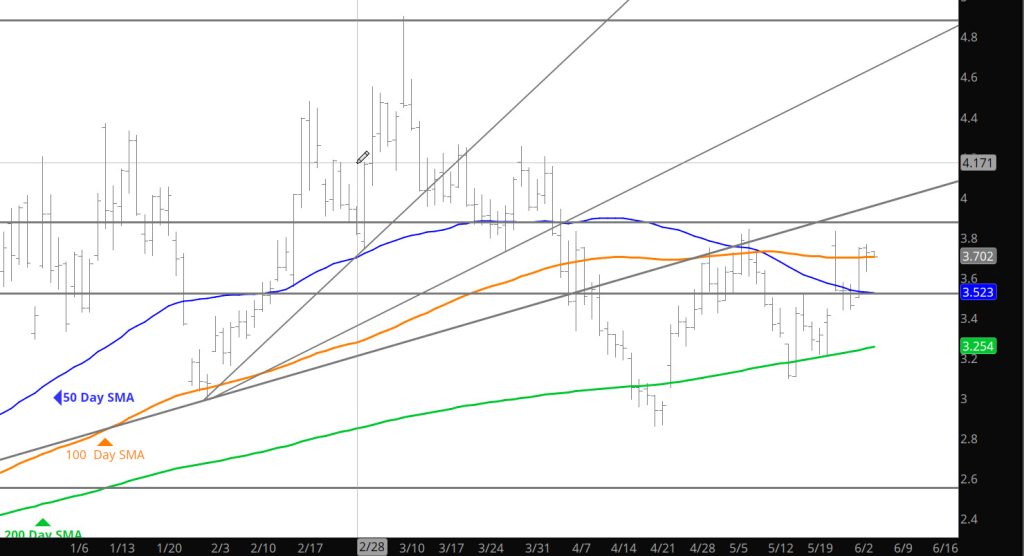
Additional Weakness Continues

Daily Continuous

Price action continued its bearish seek of the low end of the trading range yesterday and seems to be seeking the low end of the range for the upcoming period. While there is some variation as history rhymes, prompt gas continues to follow the pattern of the spring/early summer of ’23. A year ago, prompt gas traded the May high on 05/19 at $2.685: this year at $2.924 on 05/23. The early June ‘23 seasonal low traded on 06/01 while this year on 05/29. The June ‘23 – Q2 high traded on 06/28…about $.15 higher than the May high ($2.839…after which expiring July faded to go off the board at $2.603). So far, the June ’24 high has traded $.235 higher than the May high. I am always startled by how a commodity like natural gas seems to follow some of its historical traits. Let the low range become defined as the fundamental input is well established.

Major Support:, $1.595, $1.52-$1.511, $1.481, $1.312
Minor Support : $2.944, $2.64, $2.448, $2.168, $2.12, $2.00, $1.967- $1.94
Major Resistance:
$3.00, $3.16

To read The Daily Call you must be a subscriber (Current members sign in here. ) Start your subscription today.

Failure At Resistance — Failure Near Support

Daily Continuous

The run extended yesterday morning, setting a new recent high at $3.096, before serious selling took prices down, well below $3.00. From there, the market showed resilience as a rally into the close. From the close prices are still trading higher in the after-market back above $3.00. From the technical position — the action is consolidating whether the move above $3.00 will hold as support in the long run.

Major Support:, $1.595, $1.52-$1.511, $1.481, $1.312
Minor Support : $2.844, $2.64, $2.448, $2.168, $2.12, $2.00, $1.967- $1.94
Major Resistance:
$2.94, $2.97, $3.00, $3.16

To read The Daily Call you must be a subscriber (Current members sign in here. ) Start your subscription today.

Challenging Levels Not Seen For Months

Price closed above resistance level trend line (discussed in the Weekly section) and are challenging levels not seen since Jan at $3.00. Last week’s reversal of a reversal (also discussed in the Weekly) signals that the historical strength in prices during Jun is evident again in ’24. Sent out the historical chart last week and would advise using some of the averages in your analysis. For now its time to watch and see how the $3.00 level is handled.

Major Support:, $1.595, $1.52-$1.511, $1.481, $1.312
Minor Support : $2.844, $2.64, $2.448, $2.168, $2.12, $2.00, $1.967- $1.94
Major Resistance:
$2.94, $2.97, $3.00, $3.16

To read The Daily Call you must be a subscriber (Current members sign in here. ) Start your subscription today.

Gains Return

Daily Continuous

Spoke about the history of trade during June after the Memorial Day weakness. Below you see the trades from the lows (date and value) and the rally date setting the high (date and value).

The average percentage gains over the last 10 years is $.481 or 17.06%. This chart shows why the case has been made that prices rally in June setting the high for the month sometime towards the middle of the calendar month. The daily trade behavior seems to be similar to 2023 and would use this as the base case for the coming month.

To read The Daily Call you must be a subscriber (Current members sign in here. ) Start your subscription today.