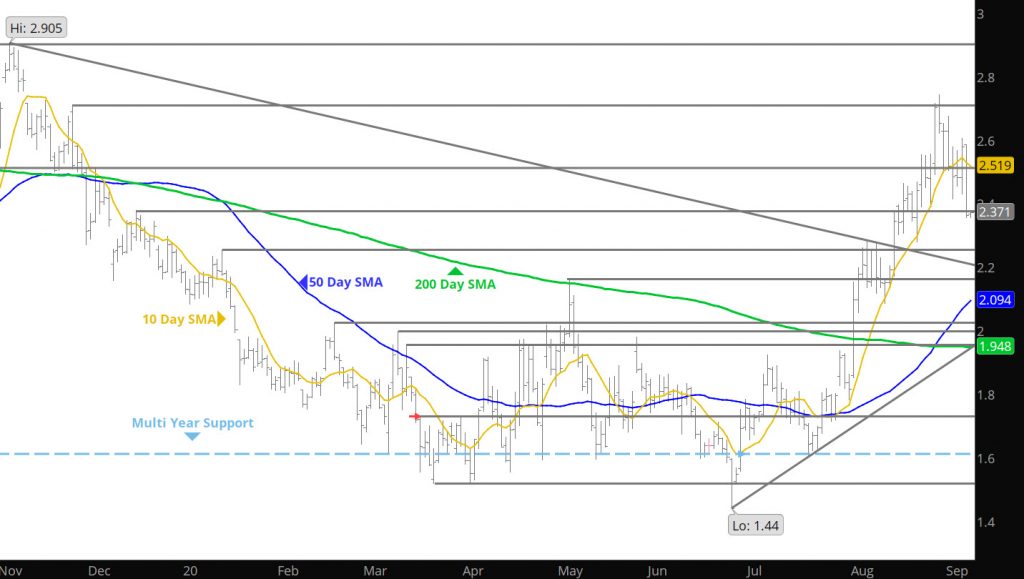
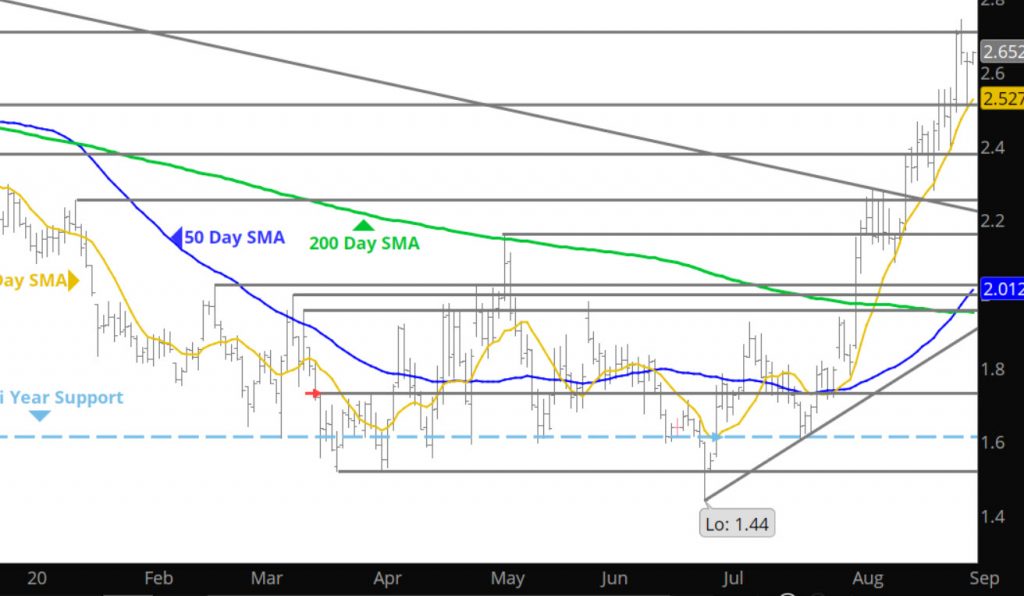
May Expiration Continues Weakly

Daily Continuous

Just a reminder — this will be the last week that the Daily will arrive in your email unless you subscribe to the website. Effective May 1, you will have to subscribe to the website to receive the Daily. This market seems to be forming a bias change and ecomenergy will be leading the analysis during the transition.

Prices closed the week just about where they started ($1.746 vs $1.753) the week after providing a solid rally to test resistance from the Feb and March highs ($2.025-$1.998) only to fail once again as discussed in the Daily last week. Only a couple of trading days remain in the May contract, and I would bet on a settlement between $1.61-$1.833.

Major Support: $1.611, $1.555-$1.519
Minor Support: $1.78-$1.765
Major Resistance: $1.993-$2.025, $2.062,$2.08-$2.102
Minor Resistance: $1.968

Traders May Be Giving Up on May

Daily Continuous

Just a reminder — this will be the last week that the Daily will arrive in your email unless you subscribe to the website. Effective May 1, you will have to subscribe to the website to receive the Daily. This market seems to be forming a bias change and ecomenergy will be leading the analysis during the transition.

The market failed again to break above the key resistance on the storage report and it looks like the trade has give up on the May contract as the June contract traded back out to $.13. It looks like May will fall subject to positioning going into expiration next Tuesday. As mentioned a while ago on this website — the key to prices into the summer was going to be how expiration of May behaved and the differential to June. Will keep you posted.

Major Support: $1.611, $1.555-$1.519
Minor Support: $1.83, $1.78-$1.765
Major Resistance: $1.993-$2.025, $2.062,$2.08-$2.102
Minor Resistance: $1.968

The Latest Variance

Daily Continuous

Just another variance yesterday as prices continue to treat this rally a little different than previous rallies. Over the last two months, after there was a failure at resistance the market could not move fast enough to test support as sellers rushed in. Yesterday (and the previous day), the market had every opportunity to facilitate the same behavior. Instead, prices found a bid and are now attempting to attack the same resistance zone around $2.00 that has held the market since January. This attack is already different than previous runs, it may have the same outcome as previous runs or it will redetermine the market for the upcoming summer.

Major Support: $1.611, $1.555-$1.519
Minor Support: $1.83, $1.78-$1.765
Major Resistance: $1.993-$2.025, $2.062,$2.08-$2.102
Minor Resistance: $1.968

Range Holds for Now

Daily Continuation

Prices could not break out above the critical resistance area short of $2.00. It is clear that there is an issue with the market, as a break above this zone will have ramifications for the remainder of 2020. Play the range, as recommended here for the last few weeks, but keep an eye on the June contract for reference (per my Daily yesterday).

Major Support: $1.611, $1.555-$1.519
Minor Support: $1.83, $1.78-$1.765
Major Resistance: $1.993-$2.025, $2.062,$2.08-$2.102
Minor Resistance: $1.968

Testing Resistance

Daily Continuous

Prices broke through and above some of the key resistance areas that have been identified over the last six weeks. Breaking above the previous April high and are now testing the March high and February highs. I have no concept of what happened yesterday and whether the abnormal large gain in nat gas (vs daily gains of late) had any relation to the absolute obliteration of the May Crude contract– we will have to monitor the press for that insight. What I know is that gas is not at the very high end of the recent range. Does it break above this time (fourth attempt) — perhaps– it may well choose to consolidate at the high end of the range through expiration and allow the June contract (and its premium to May) to take the role– but I think the market has made its intentions clear that higher prices are coming — just not sure what pace.

Major Support: $1.611, $1.555-$1.519
Minor Support: $1.83, $1.78-$1.765
Major Resistance: $1.993-$2.025, $2.062,$2.08-$2.102
Minor Resistance: $1.968

Forming a Base

Daily Continuation

Market had a nice reversal last week off of the lows discussed on Friday. It closed the week higher for the second consecutive week which are all slightly bullish bias points. What bothers me a little, is the large spread between WTI on expiration and the ensuing June contract. These types of events sometimes represent an imbalance in buyers and sellers and more importantly, those folks who spread positions off of different commodities. Not suggesting that it exists in natural gas– rather it is a concern.

Went into detail on the long term portion of the website bout comparing current prices and behavior to 2016 and would highly recommend a quick read. We are still in a range environment play accordingly.

Major Support: $1.611, $1.555$1.519, $1.481
Major Resistance:$1.883, $1.993, $2.029, $2.08-$2.10, $2.34, $2.437,
Minor Resistance:
$1.767-$1.78, $1.833

Interesting Comparisons

Spread Between December 2016 and Daily Continuous During 2016

For some reason, my distribution of the Daily yesterday did not go out — we are seeking the solution. Should you not receive the Daily in the future – please go to the web-site and access the Daily there. I highly suggest you read yesterday’s Daily because it references to today’s.

Discussed yesterday the market testing the lows for the sixth consecutive week and on the five previous found sponsorship to rebound. Yesterday makes it six straight. I also have been discussing the winter strip, summarizing the need for the strip to consolidate some of the recent gains by retracing back to $2.70 ish. Noticed today that it traded as low as $2.69, which was good to see. I want to show you how the upcoming December 2020 contract may trade compared to the upcoming summer contracts. Look back at 2016 (the last time prices traded to $1.61), in the chart above, notice how the December 2016 contract was extended to a $1.00 premium over the May contract. Interesting, as the December 2020 contract traded $1.10 over the May yesterday. In 2016, the market closed the gap in the spread over the course of the summer and the closure was from the summer months rising and the Dec 2016 contract consolidating in a range until October. This is another reason why I am not sure you want to chase the winter strip– adding to positions on declines to support may be beneficial over the longer term- but there will be more “bang-for-the-buck” in the upcoming summer months, should prices garner the support to break through resistance.

Daily Continuous

For the sixth consecutive week, prices have traded down below the key support level of $1.61 and into the $1.50’s only to find significant support. Not sure how many more times the bears want to beat their heads against that wall — time will only tell. In the mean time — play the profitable range that started yesterday.

Major Support: $1.611, $1.555$1.519, $1.481
Major Resistance:$1.883, $1.993, $2.029, $2.08-$2.10, $2.34, $2.437,
Minor Resistance:
$1.767-$1.78, $1.833

The Weekly Story Continues

Weekly Continuous

For the sixth consecutive week prices have declined down to (or below) the critical long term support at $1.61. Four of last five the declines had broken below and in only one of the six has prices closed the week below this critical level. It seems that once under $1.61– the buyers start popping their heads above ground. That trend goes all the way back to 2016 when the low was established.

Daily Continuous

Have you tired of me reminding everyone of the $.30-$.40 range trade that has provided income for the last two months– here we are again, continue until it breaks.

Declines At Last Week’s Lows

Daily Continuous

Declines continued, taking prices down near the lows of last week. The market was starting to get a feel for higher lows (weekly) but this week may eliminate that. As discussed yesterday, the winter softened a little as, but would more, especially if prices extend below last week. As stated here many times, this is still a range market (prompt) but the bullishness resides in the winter and calendar 2021.

Major Support: $1.611, $1.555$1.519, $1.481
Major Resistance:$1.883, $1.993, $2.029, $2.08-$2.10, $2.34, $2.437,
Minor Resistance:
$1.767-$1.78, $1.833

Prompt Treads Water- Winter Gains

Daily Continuous
Winter 20/21 Strip with RSI

First things first– just a reminder that the Daily will continue free until May 1, 2020 at which time you will need to be a subscriber– please see the website for details.

I wanted to expand on the website Weekly published yesterday, as a couple of you contacted me regarding the significant gains in the Winter strip as compared to the prompt May. I would not advise chasing the winter and the chart above shows why. The strip is over bought and currently in the extreme zone for momentum indicators. It will need to back and fill and test the breakout zone around $2.70 so patience is required. It is becoming clear (with today’s extension) that something is garnering serious support for winter and all of 2021 for that matter. Not immersing myself in fundamentals I am limited as to an opinion but I do read that with the destruction of oil prices and production- some of the associated gas may become an issue. As mentioned– I have no clue– but something is clearly driving interests and the prompt May has nothing to do with it. In fact it remains in the middle of the range discussed yesterday.