To read The Daily Call you must be a subscriber (Current members sign in here. ) Start your subscription today.
Author: Willis Bennett
Expiration At the End of Week
To read The Daily Call you must be a subscriber (Current members sign in here. ) Start your subscription today.
Not Much To Add
To read The Daily Call you must be a subscriber (Current members sign in here. ) Start your subscription today.
Late PM Catches Bid
To read The Daily Call you must be a subscriber (Current members sign in here. ) Start your subscription today.
Been Here Before
To read The Daily Call you must be a subscriber (Current members sign in here. ) Start your subscription today.
Energy Complex Quiet
To read The Daily Call you must be a subscriber (Current members sign in here. ) Start your subscription today.
Crude Leadership Slows?
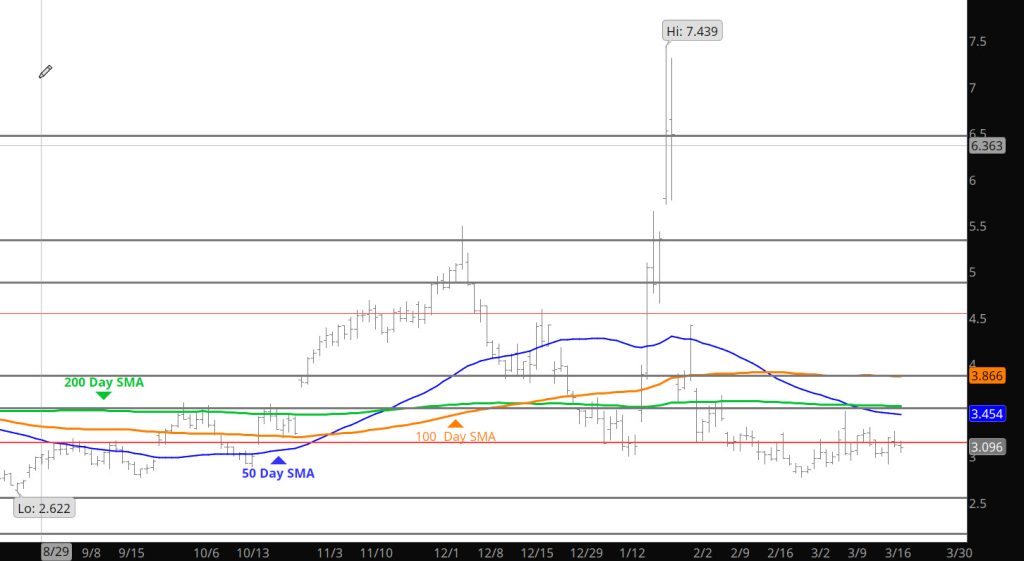
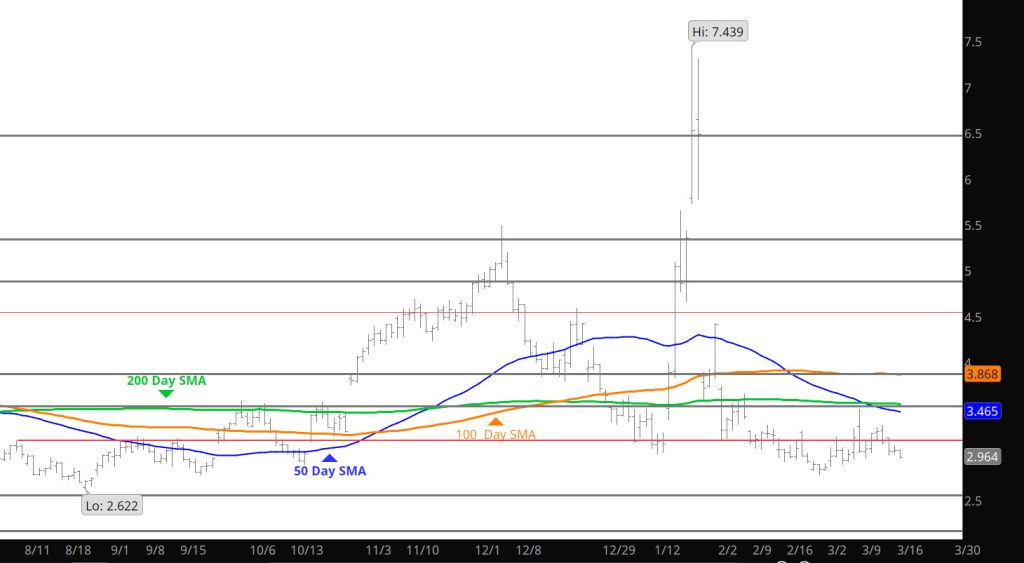
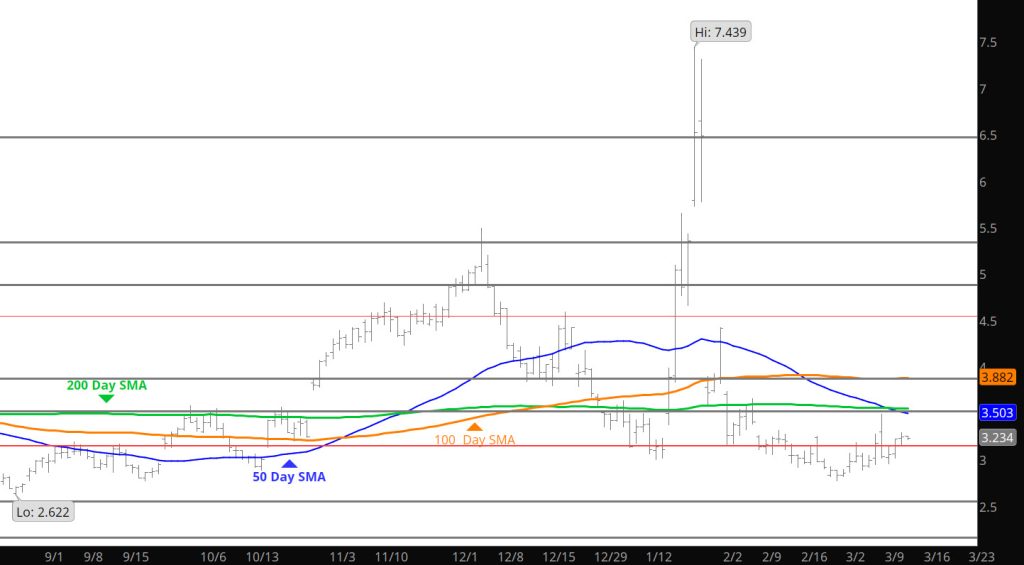
Daily Continuous
While it is likely that NatGas will follow the rallies and support found in the Crude trade- it is becoming evident that the Crude trade may be “calming” which will limit any dramatic moves in gas. Trade seems to be quiet in the early Sunday night markets in both commodities. While traders looked to the weather report releases a month ago– now we have to watch the news channels. One solid element of trade, with the slowing of volatility — options can provide a lower cost avenue for directional bias.
Major Support: $3.051, $2.87-$2.84, $2.640-$2.57
Minor Support/Resistance : $3.16-$3.148, $3.136, $3.02-$2.97
Major Resistance: $3.35, $3.486-$3.494, $3.567, $ 3.736
Gas Continues Shadowing Crude
To read The Daily Call you must be a subscriber (Current members sign in here. ) Start your subscription today.
Storage Gives Neither Support or Selling
To read The Daily Call you must be a subscriber (Current members sign in here. ) Start your subscription today.
Stool Found the Fourth Leg

To read The Daily Call you must be a subscriber (Current members sign in here. ) Start your subscription today.