Weekly Continuation
The suite of indicators that I try to watch and monitor for three decades, will not tell you where an exact top or bottom is but they will tell you something about danger and opportunity. One of the rarest of all chart formations in natural gas (and most everything else) is an “outside” monthly reversal particularly when accompanied by exceptional volume (an “island” reversal is another one). This months reversal off of the highs now has traded below last months low. The last one occurred during January ’24. The high of that downside reversal was not the high for the year, but it took prompt gas until November to work its way to a higher high. In the entire history of natural gas trading at the NYMEX a total of 427 expired prompt contracts, there has been only one “outside” monthly reversal during calendar December…that one also to the downside from an EXTREMELY overbought technical condition (similar to this year). After trading through the calendar November ’05 high early in its tenure, prompt January ’06 traded to $15.780 on December 13th. On December 28th as it went to settlement that prompt traded through the November low ($10.880). That 12/13/05 high was a multi – year high that has not been tested since.
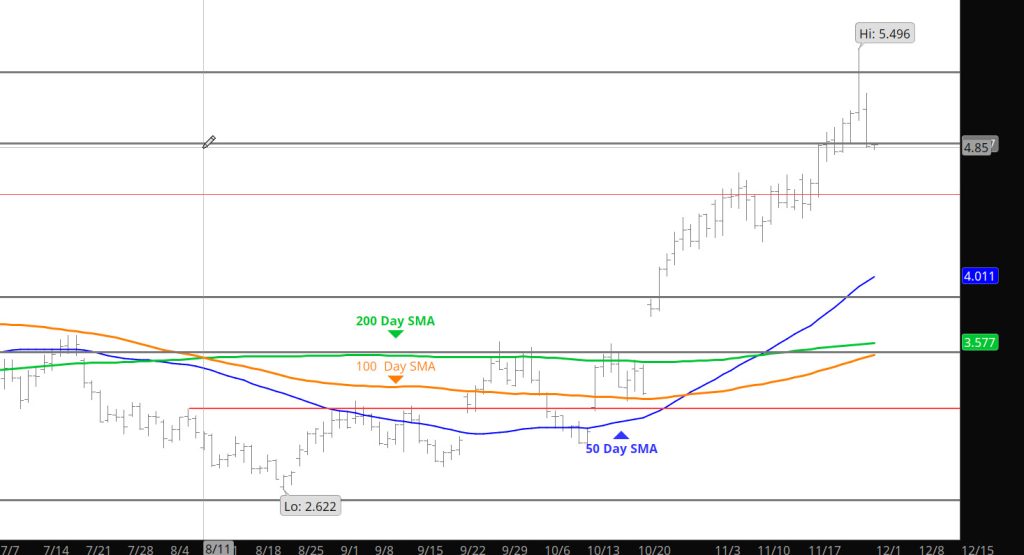
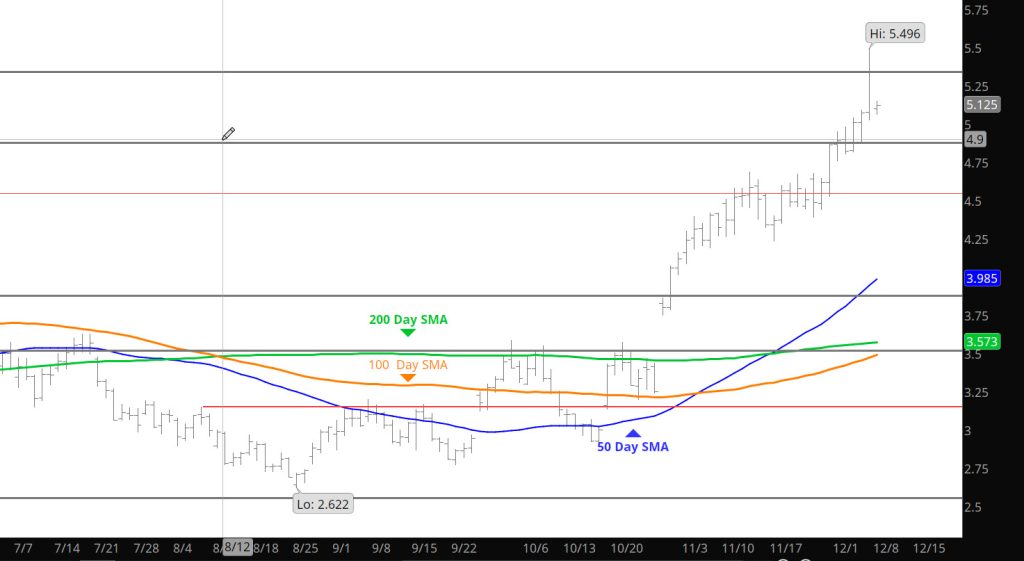
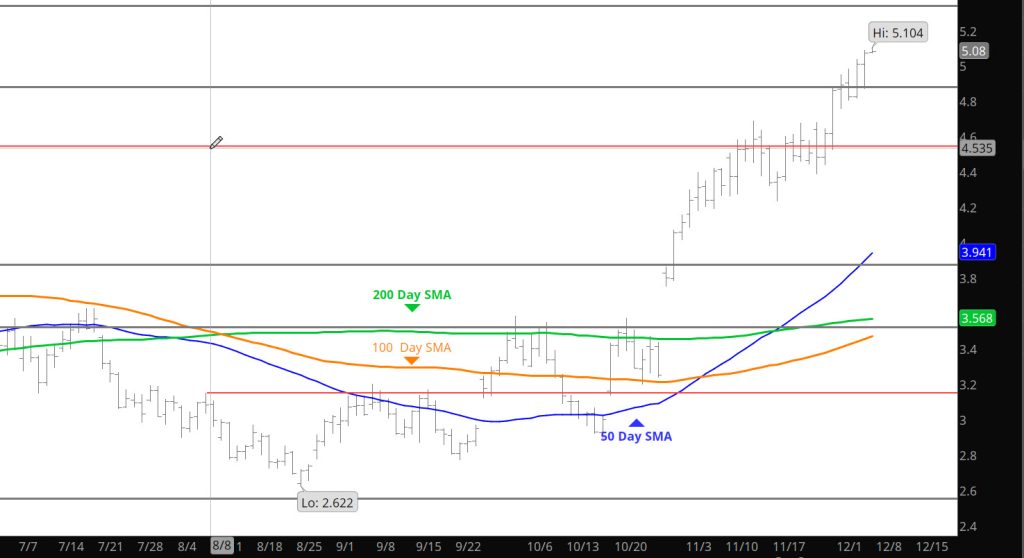
In terms of absolute price the December 5th high ($5.496) pales in comparison but December ’25 has some characteristics in common with December ’05. In ’05 price had just about doubled from the August low…this year +109% from an August low. Both highs traded within the counter seasonal window during the first half of December (typically, prompt gas trades an early/mid – December low and then rallies…vs an early/mid – December high before falling). And, as you might suspect in both years prompt gas was triggering EXTREME readings on virtually every indicator and threatening momentum divergence.
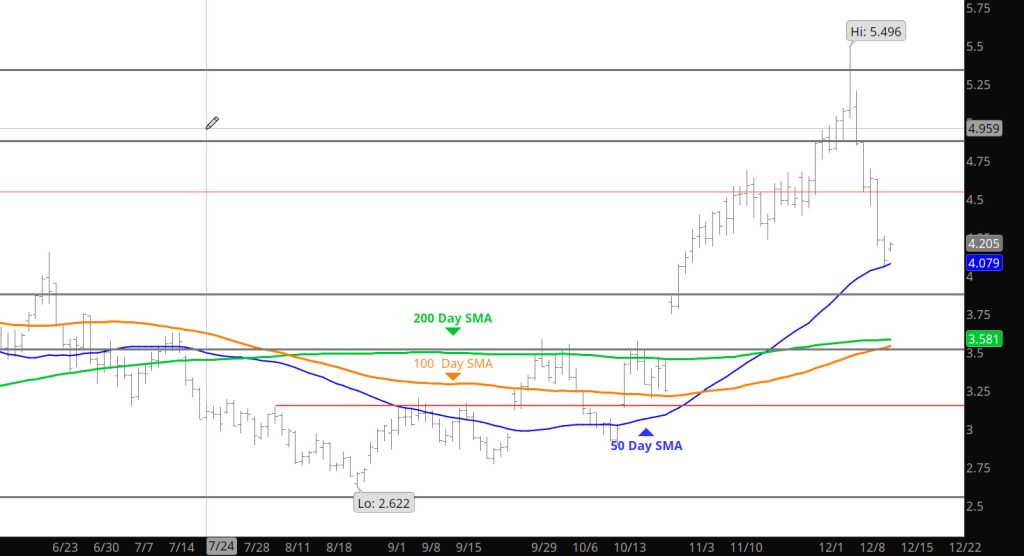
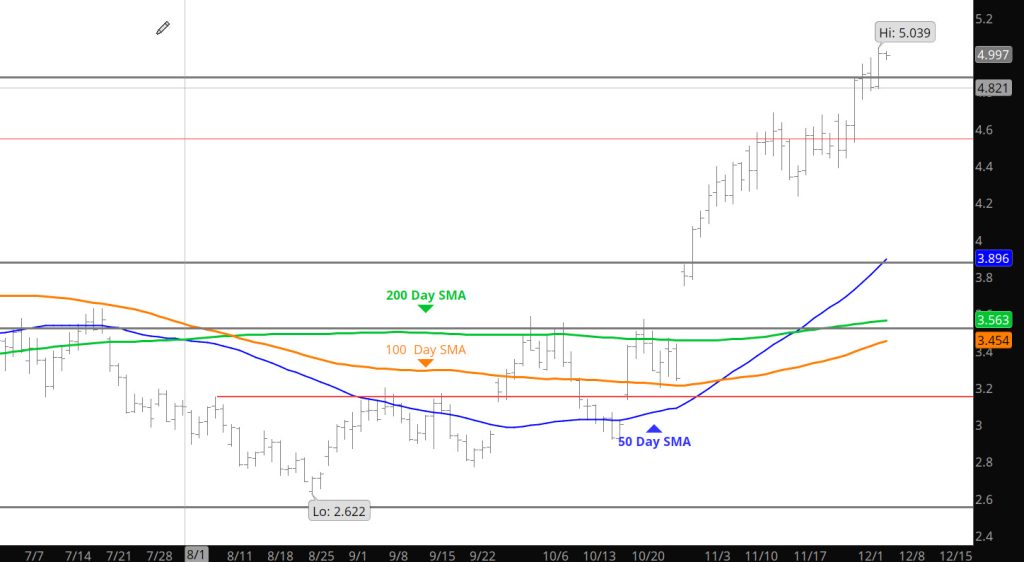
With all of that said, expectations are that January gas rallies from $4. Not back to the highs or anywhere close, but rallies. In the space of one week prompt gas retraced 50% ($4.059-the week’s low was $4.065) of the rally from the August low and nearly 38.2%. Those are typical retracement percentages in a bull market. The 50 – continuation day SMA is $4.052. That moving average and the retracement levels are substantial mathematical support along with the previous lows of the January contract and there is the expiration gap left on 10/30 that begins at $3.786 and is underpinned by the 200 – days and the 20 – weeks SMAs, a little further down.
Major Support: $4.219-$4.139,$4.083,$4.055,
Minor Support/Resistance : $4.46-$4.42, $3.75,$3.65
Major Resistance: $4.901, $5.01, $5.325, $5.37