To read The Daily Call you must be a subscriber (Current members sign in here. ) Start your subscription today.
Author: Willis Bennett
Weakness To Continue
To read The Daily Call you must be a subscriber (Current members sign in here. ) Start your subscription today.
Quiet Before the Gremlins
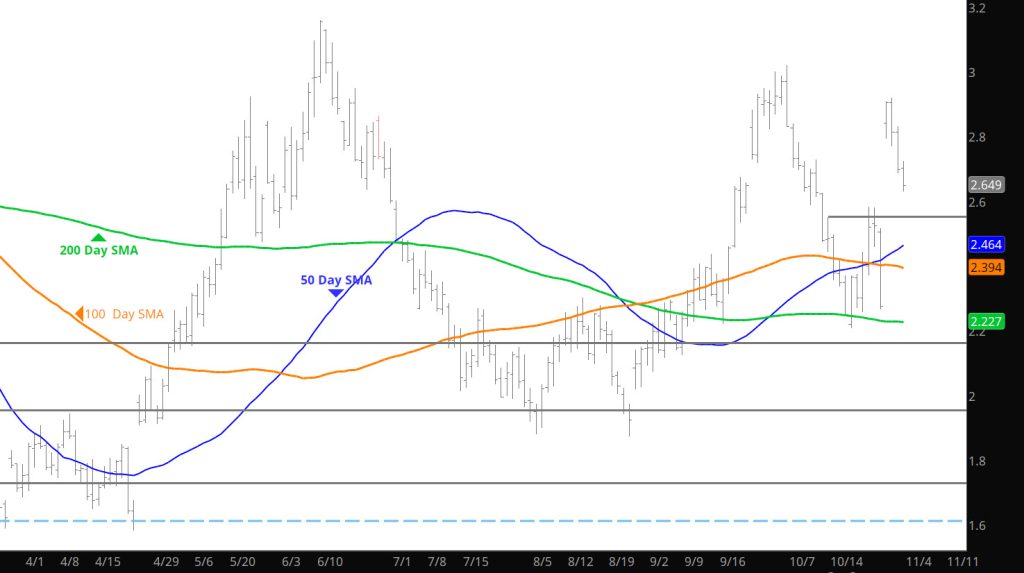
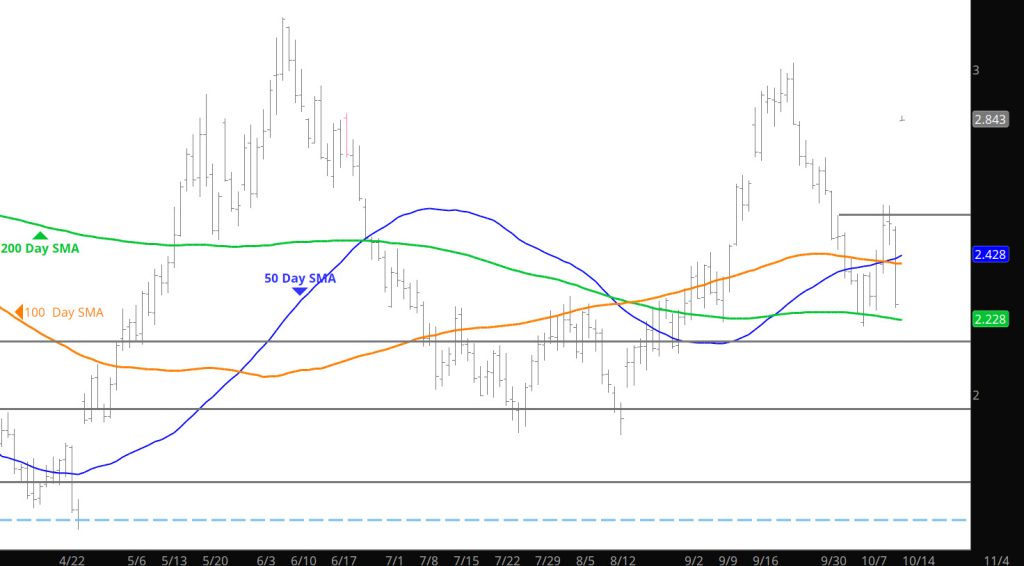
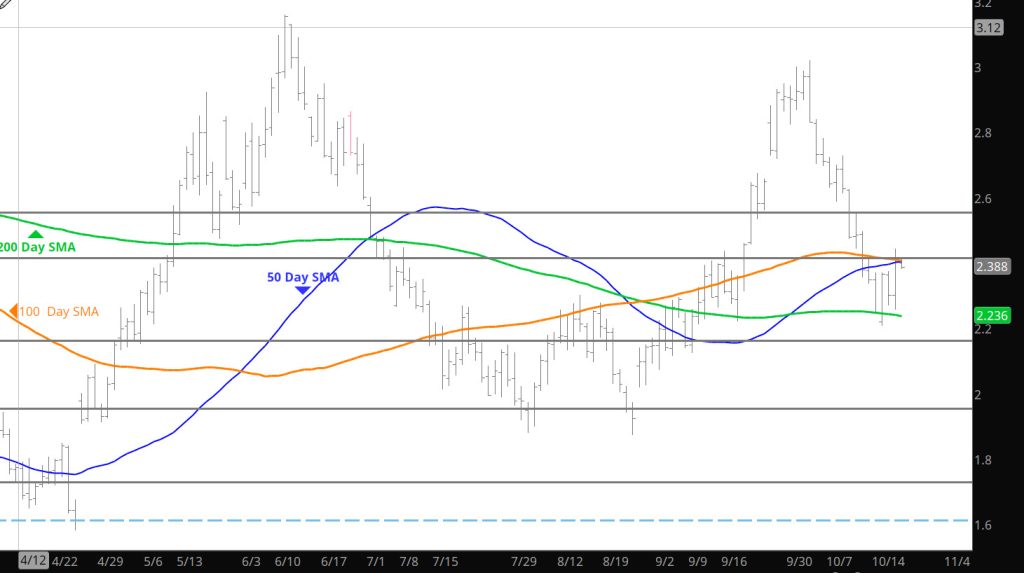
Daily Continuous
Prices did little to indicate the bias for the upcoming storage release. Good time to sell some out of the money premium and see what happens.
Major Support:,$2.648, $2.35, $2.112, $2.026-2.00, $1.991, $1.93 ,$1.642, $1.605
Minor Support : $1.856,$1.89-$1.856
Major Resistance: $2.727-$2.784, $3.00, $3.16
Winter Contracts Now Rule
To read The Daily Call you must be a subscriber (Current members sign in here. ) Start your subscription today.
2024 Expiration Behavior Returns
To read The Daily Call you must be a subscriber (Current members sign in here. ) Start your subscription today.
What Does this Expiration Bring Us
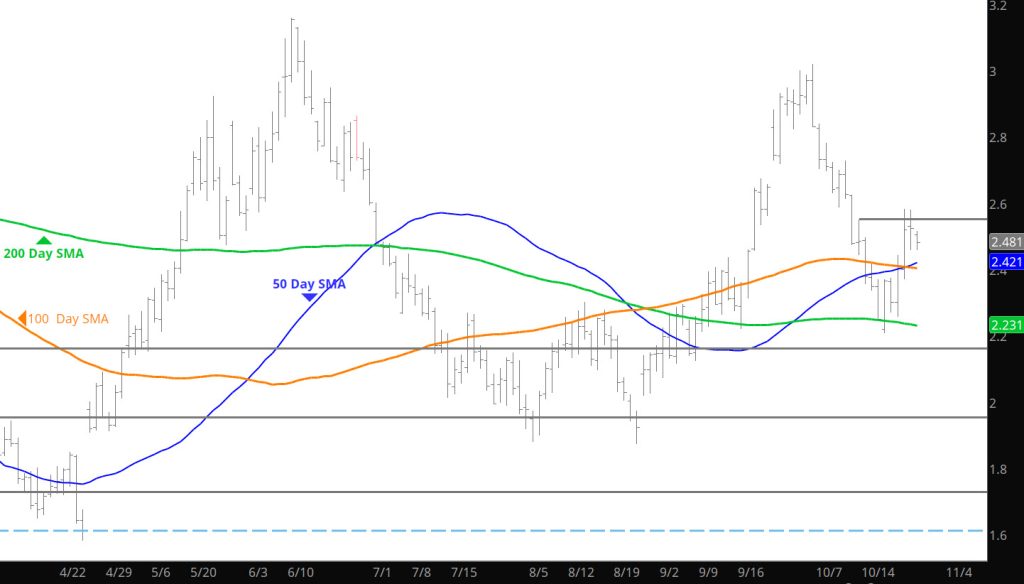
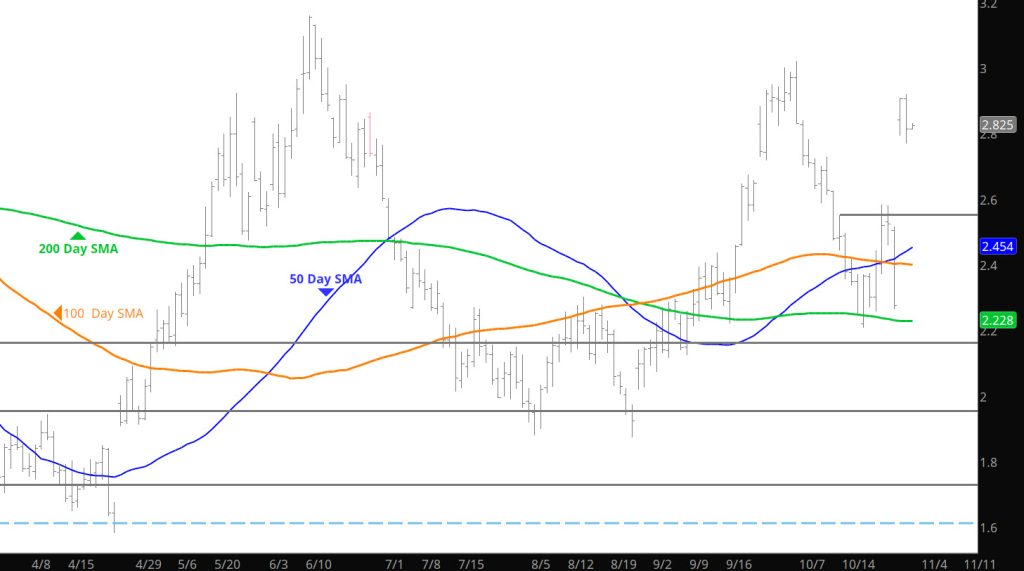
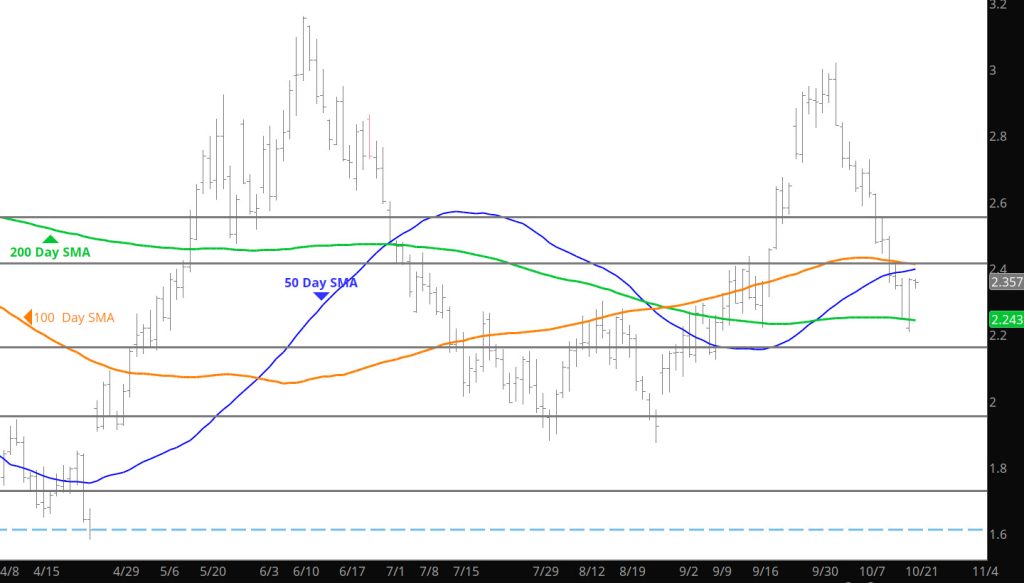
Daily Continuation
Mentioned in the Weekly section that each expiring contract month from February through September ’24 was “amply” offered as it went off the board. That changed last month. October traded the high of its tenure as prompt on the day it went to settlement at $2.585. Not sure what will happen with the Nov expiration but would not expect major volatility. My guess would be it is neither well bid or offered into expiration, as the market is seeking its near term commitment.
Major Support:, $2.35, $2.112, $2.026-2.00, $1.991, $1.93 ,$1.642, $1.605
Minor Support : $1.856,$1.89-$1.856
Major Resistance: $2.63, $2.727-$2.784, $3.00, $3.16
Important Expiration This Week
To read The Daily Call you must be a subscriber (Current members sign in here. ) Start your subscription today.
What Was That
To read The Daily Call you must be a subscriber (Current members sign in here. ) Start your subscription today.
Brief Break Above
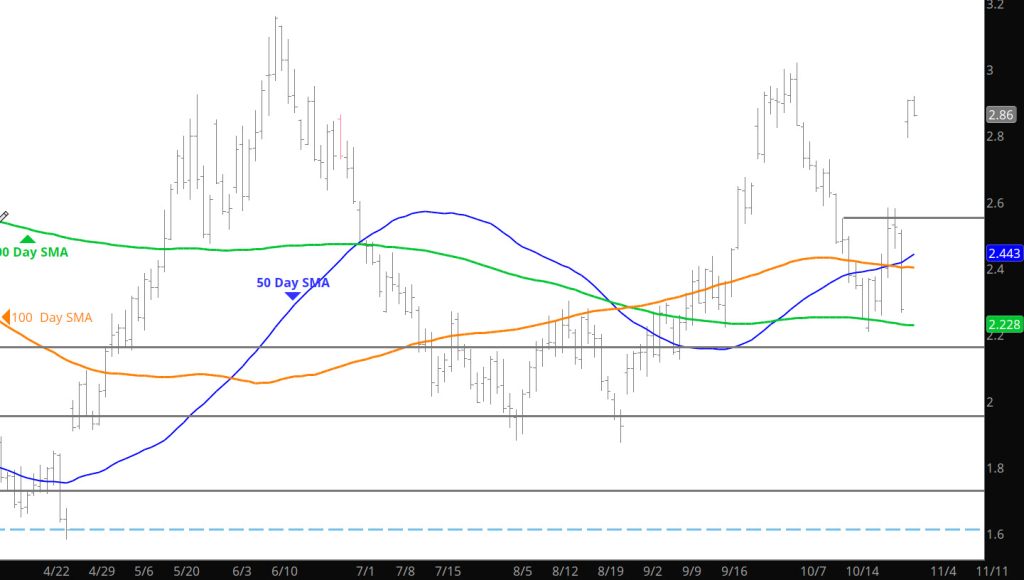
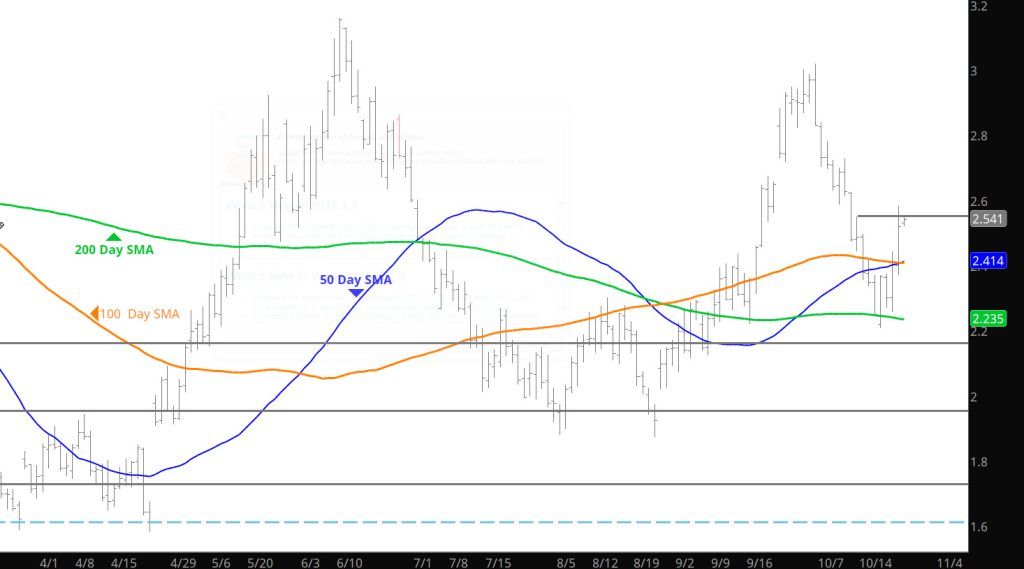
Daily Continuous
Did not see a break above the recent range coming but that was what happened yesterday. Not sure of the reason or focus for the gains except for the markets needing to challenge the highs (and potentially lows) of recent range trading. Perhaps, it was in advance of a storage release surprise coming tomorrow and known by some.
Major Support:, $2.35, $2.112, $2.026-2.00, $1.991, $1.93 ,$1.642, $1.605
Minor Support : $1.856,$1.89-$1.856
Major Resistance: $2.63, $3.00, $3.16
Small Bounce Off Support
To read The Daily Call you must be a subscriber (Current members sign in here. ) Start your subscription today.