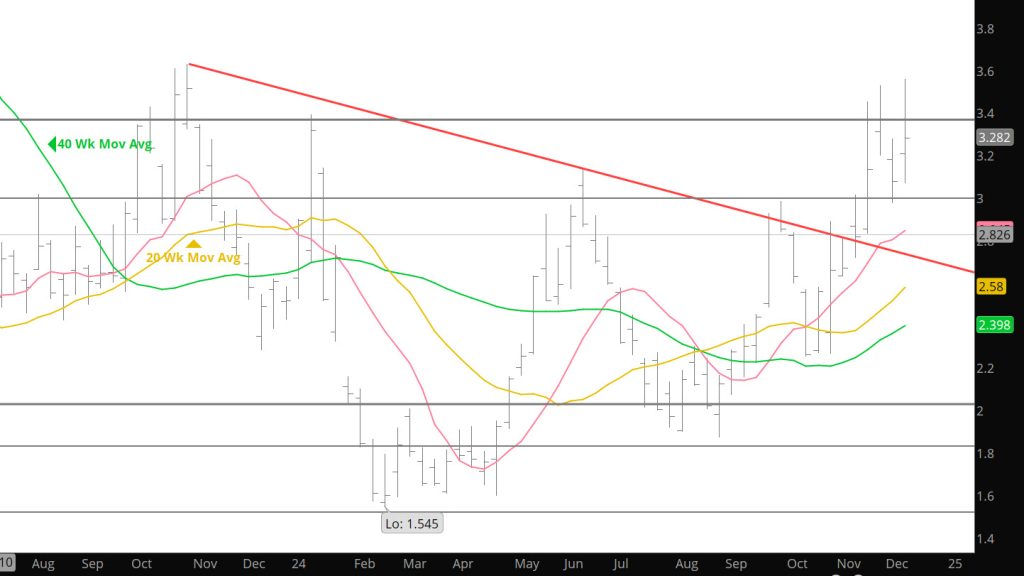
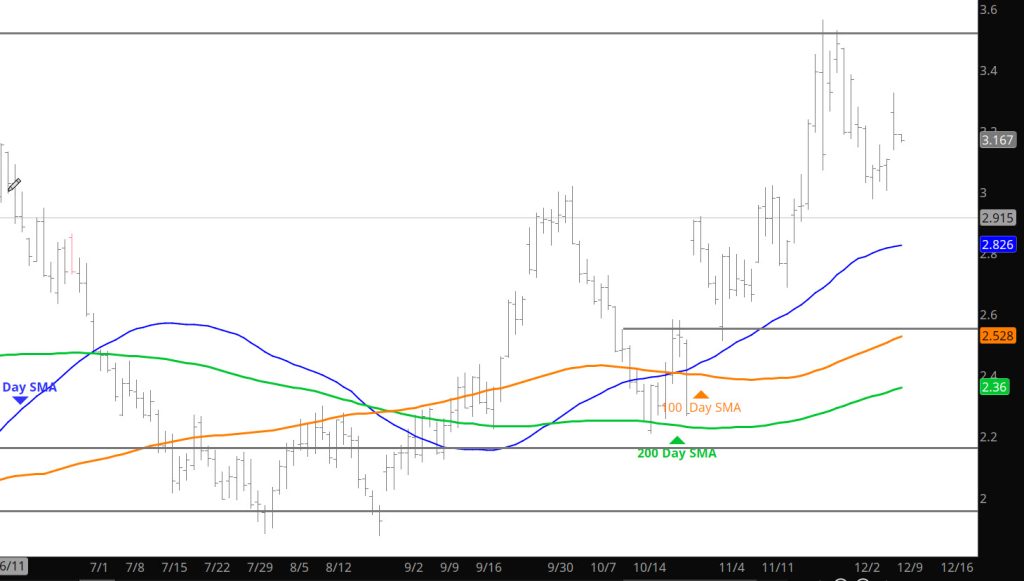
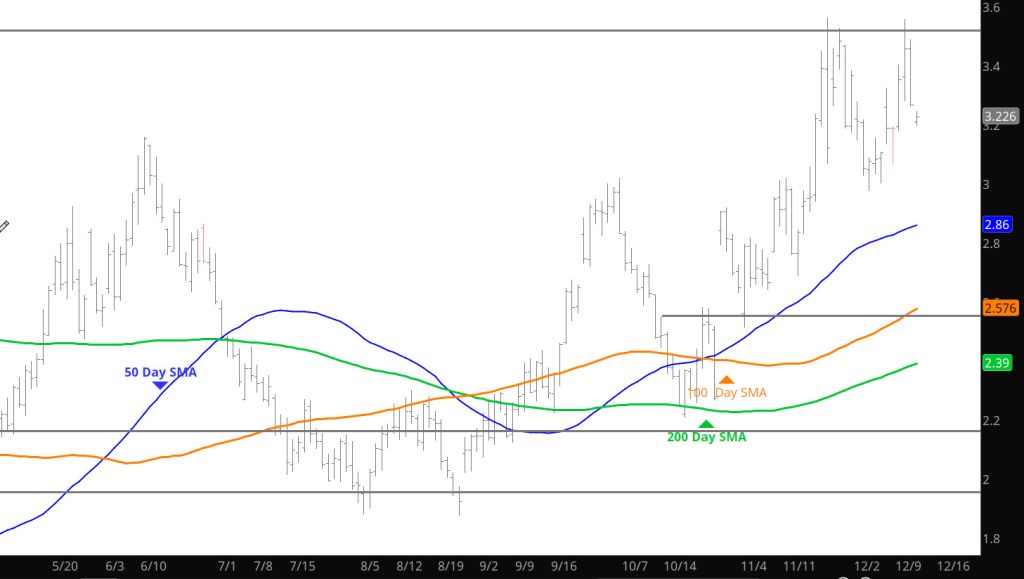
Tad Dramatic

Daily Continuous

That was a bit of drama going down when no one wants to buy– now we have a whole new market in the same old range that held the market in December. Lets see where this all leads us.

Major Support:, $2.00, $1.991-$1.96, $1.795-$1.766
Minor Support $2.62, $2.47, $2.38-$2.26, $2.17
Major Resistance $3.00, $3.16, $3.48, $3.536, 3.59
, $3.65

Strong Finish –Trouble Brewing

Weekly Continuous

February quickly retreated toward targeted support ($2.600 and $2.700). After trading the low of the week($2.694) February recovered and developed a dramatic bout of short covering spiking to a high of $3.392 with exceptional volume. Having already traded a range of $.698…the widest range for any two days since the beginning of the collapse from the December ’22 high, February traded within Tuesday’s range ($2.884 – $3.392) for the balance of the first full week of ’23, but again finished the week with a substantial bid. February posted its highest close since the first Friday of November, just short of the resistance presented by the lower boundary of a range the current prompt traded in from April through October which includes the gap left on the February chart on November 6th $3.635 – $3.681 and February’s 40 – week SMA…which it failed at twice before breaking down. On a continuation basis prompt gas closed just below a band of weekly closing resistance between $3.330 and $3.473 ). The daily continuation gap is $3.407 – $3.452 and two standard deviations above the 20 – week SMA is $3.462. That represents a whole lot of areas to bring sellers back, Unless the prompt can extend its rally…as another strong weekly close suggests it will, after posting the highest daily close since 11/03 ($3.515), it is in danger of a short – term momentum divergence…and in any event is extremely short – term overbought. Expect selling.

Something that caught my eye and so I checked previous years and it failed to turned up any other year that there was anything close to the premium over March at February has at expiration. So, the question becomes whether February gives up much of that premium over its last nine trading days or March begins to catch up. Based on my comments and foregoing analysis of resistance, extension nearly two standard deviations above the twenty week and the extreme short – term overbought condition expect that February retreats from a challenge of the October highs to redefine support while March and the Q2 months begin to find more sponsorship.

To read The Daily Call you must be a subscriber (Current members sign in here. ) Start your subscription today.

Perhaps the Market Showed Too Much Strength

Daily Continuous

Go into last week’s trade and the results in the Weekly Section–From a daily perspective the market is confirming the lack of follow through in the light Monday trade as prices rejected any type of follow-through of the rally. One element discussed in the Weekly section is the historically extreme premium the Feb has to Mar. Check out the chart below and you will see that the extreme variance is starting to narrow.

February less March Contracts

Mentioned in the Daily last week that a source of the short covering was the Feb contracts being bought to cover the short — Then I mentioned that the short covering rally had a slight gain in open interest– the differential can’t confirm that the reason for the gain was those traders who were covering shorts “rolled” them into March but looking at the the breakout in the differential spread may be an indication. If you cover a short but roll it to the next month there is no change in open interest, but you have sold the next month — putting pressure on that contract. This will be interesting to trade in the coming week as March may gain to narrow the differential while Feb declines.

To read The Daily Call you must be a subscriber (Current members sign in here. ) Start your subscription today.

Is It Going To Consolidate Gains?

Daily Continuous

Interesting day trade as prices firmed after open interest fell on Wednesday. It may be that the trade is starting to develop a more positive bias it will need some additional gains — however small– in the near term.

Major Support:, $2.00, $1.991-$1.96, $1.795-$1.766
Minor Support $2.62, $2.47, $2.38-$2.26, $2.17
Major Resistance $3.00, $3.16, $3.48, $3.536, 3.59
, $3.65

Suspected This

Daily Continuous

Want to apologize for any issues with yesterday’s Daily — (there was only one complaint) — but it reminds me to remind all of you that if you don’t have a Daily in your email — it maybe an email issue — so be sure to log in and check the website. Unless I am ill there should be a posting.

On to the market– once again a big short covering event ran out of steam there were no follow through buyers to build on the price. Not over yet as I noticed that total open interest had a small gain yesterday (according to the CME) while the February contract had significant declines in open interest. Perhaps the short covering was just rolling forward and selling a differed contract but covering the Feb exposure. Time will tell as the week wraps up.

Major Support:, $2.00, $1.991-$1.96, $1.795-$1.766
Minor Support $2.62, $2.47, $2.38-$2.26, $2.17
Major Resistance $3.00, $3.16, $3.48, $3.536, 3.59
, $3.65

THAT Is A Short-Covering Rally

Daily Continuous

The short covering started on Monday as open interest decreased as prices rose, but yesterday was the big run and I don’t have confirmation from the CME– but I expect a significant amount of short open interest left the market. It really means little to the trader as I am waiting to see gains in open interest as prices rally. We have witnessed these types of rallies in the last year only to have prices reverse back lower once the short were eliminated. From my perspective — thankfully, I had stops in just above the resistance area mentioned yesterday– so damage was minimal. Now I want to wait and see how much leg this rally can have.

Major Support:, $2.00, $1.991-$1.96, $1.795-$1.766
Minor Support $3.00, $2.87, $2.62, $2.47, $2.38-$2.26, $2.17
Major Resistance: $3.16, $3.48, $3.536, 3.59
, $3.65

To read The Daily Call you must be a subscriber (Current members sign in here. ) Start your subscription today.

Solid Short Cover Based Rebound

Daily Continuation

It is time to watch the rubber meet the road. The recent rally has been identified as the cold and extended cold coming, forcing some shorts to cover– but watching trade while watching the Championship game– I am witnessing some serious selling taking prices off the high $2.90’s. Have no idea as to the longer range forecasts and really care not. The market is at the high end of the resistance and will be looking at selling resistance.

Major Support:, $2.00, $1.991-$1.96, $1.795-$1.766
Minor Support $2.62, $2.47, $2.38-$2.26, $2.17
Major Resistance $2.786-$2.865, $3.00, $3.16, $3.48, $3.536, 3.59
, $3.65

To read The Daily Call you must be a subscriber (Current members sign in here. ) Start your subscription today.

Break Above Resistance Continues

Daily Continuous

Prices broke above near term resistance and held strong through the end of the week. Due to the strength, I expect prices to remain firm today regardless of the late Sunday weakness showing the start of declines, regardless, the market is likely to remain range bound this coming week.

Major Support:, $2.00, $1.991-$1.96, $1.795-$1.766
Minor Support $2.47, $2.38-$2.26, $2.17
Major Resistance, $2.786-$2.865, $3.00, $3.16, $3.48, $3.536, 3.59
, $3.65

To read The Daily Call you must be a subscriber (Current members sign in here. ) Start your subscription today.

A Bullish Start to 2024

Weekly Continuous

The prompt opened at $2.605, creating a daily continuation gap above Friday’s high of $2.561 Despite February quickly filling the gap the indication that it had brought was validated by a reversal and follow through that left the prompt above January settlement and the first trading day of January high. Extension of the rally to test, and close above the continuation 50 – day (for the first time since 11/16), plus a weekly close above the 10, 20, and 40 – weeks SMAs AND the December high leaves $2.524 the odds on favorite for the January low.

While all of that bullish technical data points is important –it is not intended to suggest that prompt gas has kicked off on one of its periodic winter rocket rides, nor that the perennially amply offered February contract won’t back and fill from this first week of ‘24’s strong close. There is an abundance of well – defined resistance including but not limited to 50% retracement of the decline from the October – Q4 high and the violated trend line drawn from the April – May – June lows, between $2.906, the late Friday high of the holiday abbreviated week, and $3. It does suggest a change in the way traders are approaching the gas market from actively selling rallies to buying during bouts of weakness to test progressively higher levels of support. Since the 12/13 trade and reversal from $2.235 prompt gas has traded higher lows (defined as a higher low followed by a higher high) of $2.385 (12/19) and $2.412 (12/28) and now $2.524 (01/02) can be added to that list.

To read The Daily Call you must be a subscriber (Current members sign in here. ) Start your subscription today.

Slight Break Out Above Resistance

Daily Continuation

Not sure you want to load up the bank on this slight break out above the recent range. The market trades on the weather reports so any long term positioning is rather risky. Short term (daily trades) can be profitable on a very short horizon.

Major Support:, $2.00, $1.991-$1.96, $1.795-$1.766
Minor Support $2.47, $2.38-$2.26, $2.17
Major Resistance$2.62, $2.786-$2.865, $3.00, $3.16, $3.48, $3.536, 3.59
, $3.65

To read The Daily Call you must be a subscriber (Current members sign in here. ) Start your subscription today.