To read The Daily Call you must be a subscriber (Current members sign in here. ) Start your subscription today.
Author: Willis Bennett
Back to the Range
Daily Continuous
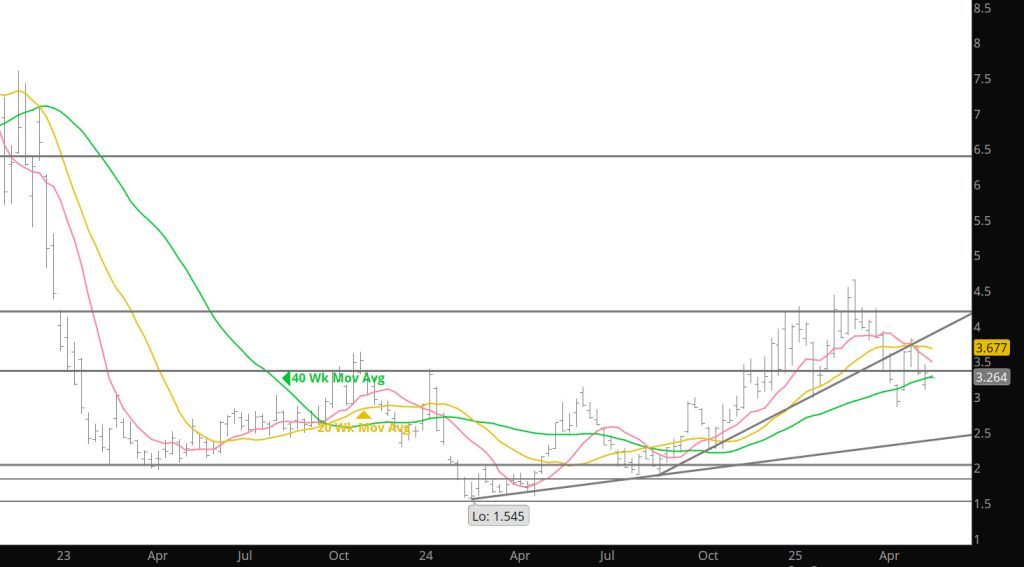
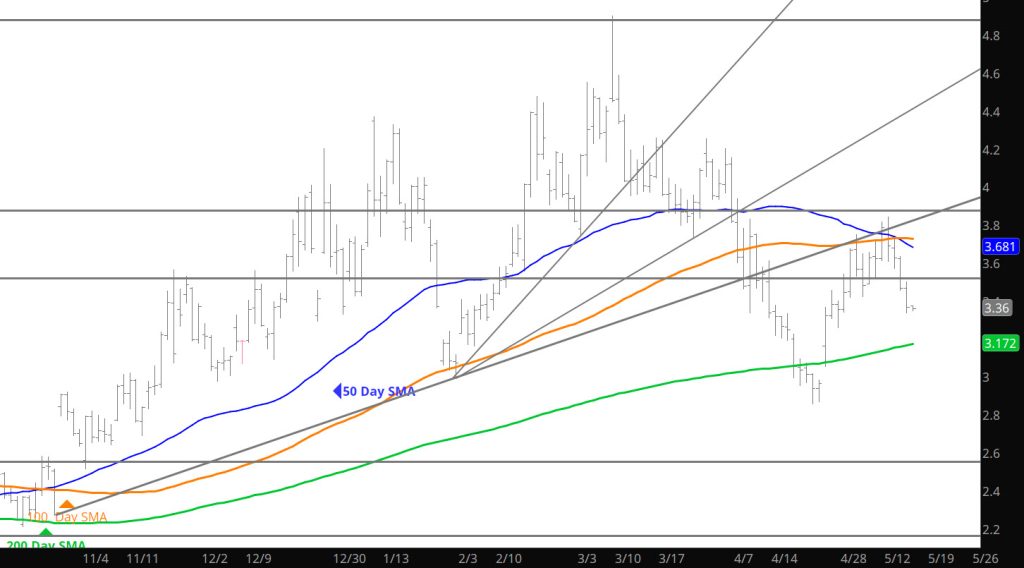
With the storage release I was wondering if the recent strength would be curtailed and that it was. The heading says it all – back into the range that June has created.
Major Support: $3.054-$3.007, $2.97, $2.727, $2.648,
Minor Support :
Major Resistance: $3.26-$3.305, $3.46, $3.628, $3.86, $4.168, $4.461, $4.501,
Solid Bounce

Daily Continuous
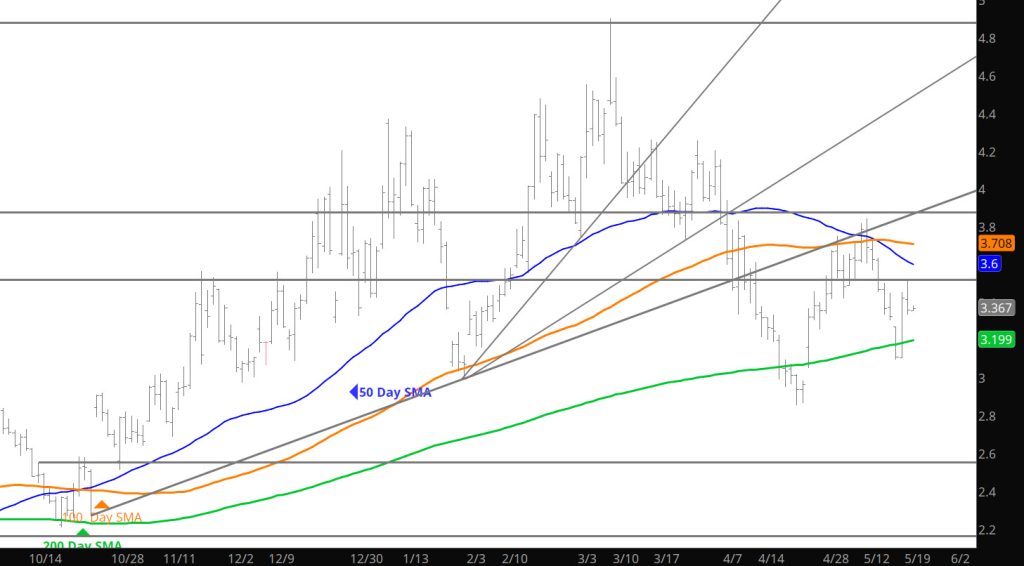
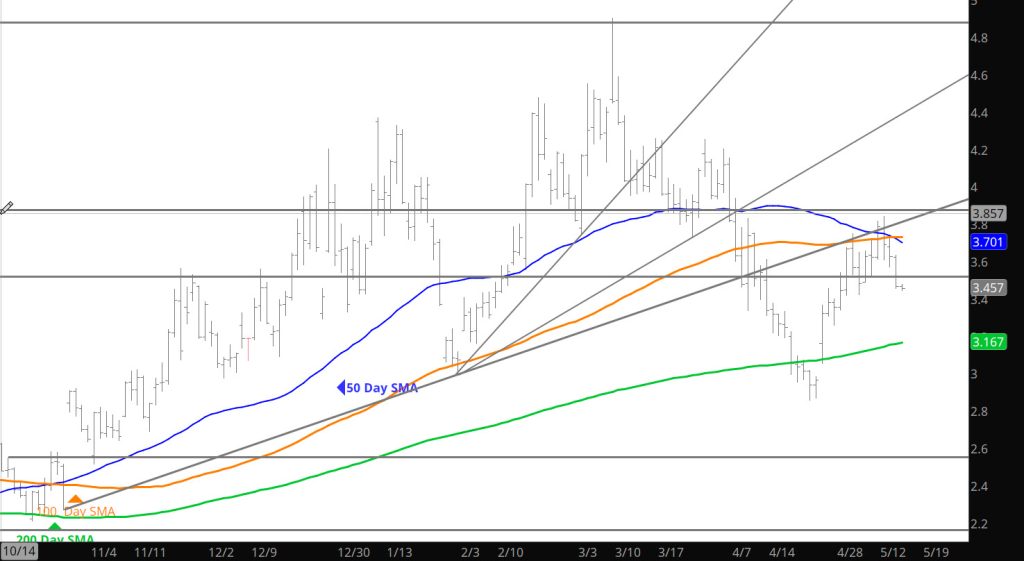
Prices refused to extend down to the April low of June gas and performed a solid rebound. Not sure this is a rally that should be jumped onto — there is a solid possibility that further gains will be hindered by the storage release coming up. Regardless, the market continues to trade with in the range that June has developed.
Major Support: $3.054-$3.007, $2.97, $2.727, $2.648,
Minor Support :
Major Resistance: $3.26-$3.305, $3.46, $3.628, $3.86, $4.168, $4.461, $4.501,
Prompt Approaching Lows
To read The Daily Call you must be a subscriber (Current members sign in here. ) Start your subscription today.
Expect Additional Weakness
To read The Daily Call you must be a subscriber (Current members sign in here. ) Start your subscription today.
Storage Release Confirms Declines
Daily Continuous
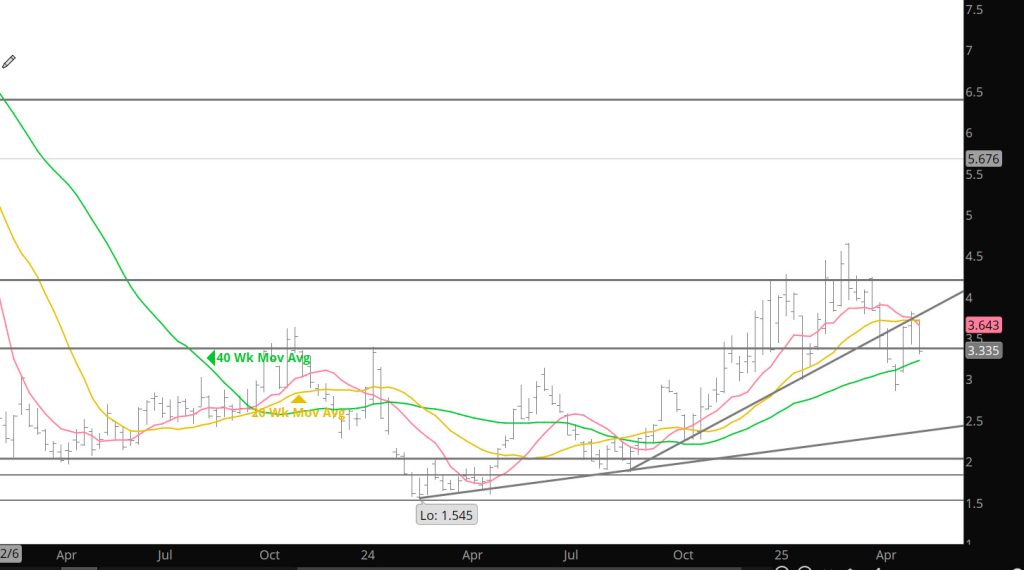
The slightly bearish storage data confirmed the near-term bias of declining prices. The Weekly close will be important for the near term price action but remember, we are still in a range for prices — just testing the low end of the range.
Major Support: $3.26, $2.97, $2.727, $2.648,
Minor Support :$3.423
Major Resistance: $3.628, $3.86, $4.168, $4.461, $4.501, $4.551, $4.746-$4.75, $5.03
Lows From Early May Challenged
To read The Daily Call you must be a subscriber (Current members sign in here. ) Start your subscription today.
Failure At Highs — Consolidation Continues

Daily Continuation
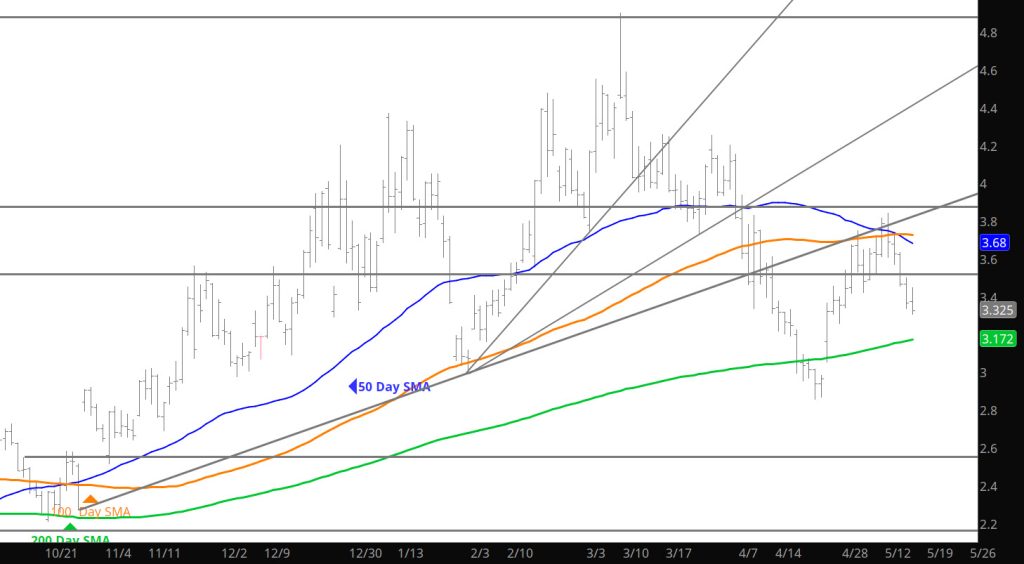
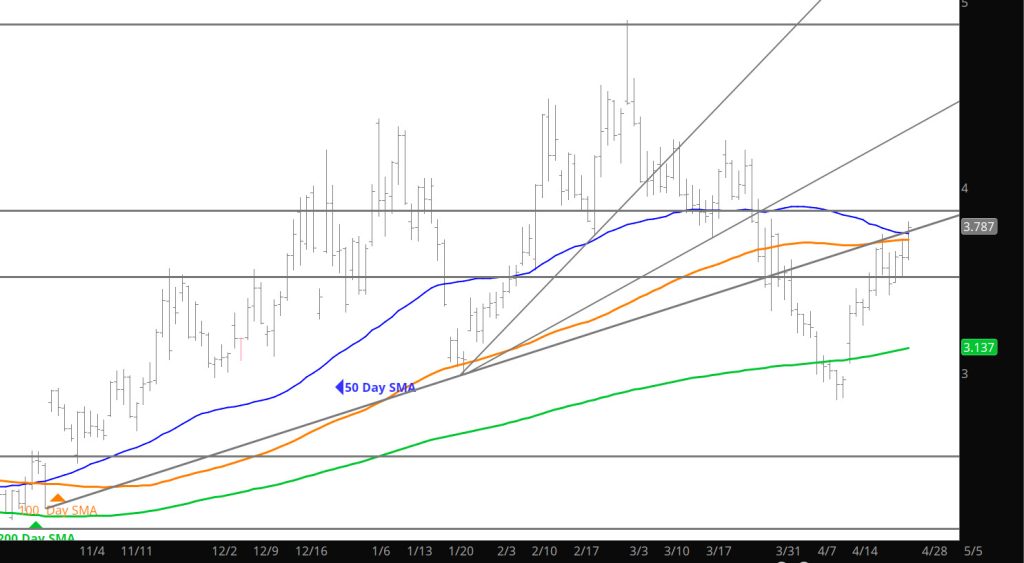
Price action rallied to a higher high only to feel the affect of altitude and retreated back into the comfort zone of the range for June gas. I would think that gas may make another run to the highs but it will need to close above the Moving averages converging just above yesterday’s close (see Daily Chart above) to catch some possible momentum.
Major Support: $2.97, $2.727, $2.648,
Minor Support :
Major Resistance: $3.628, $3.86, $4.168, $4.461, $4.501, $4.551, $4.746-$4.75, $5.03
Bullish End of Week
Daily Continuous
Discuss the price action in 2025 compared to previous years in the Weekly section, last week’s high close was a bullish indicator but consistent with history. Now, the issue is the continuance of the bias or failure at resistance, early Sunday night trade gives no insight.
Major Support: $2.97, $2.727, $2.648,
Minor Support :
Major Resistance: $3.628, $3.86, $4.168, $4.461, $4.501, $4.551, $4.746-$4.75, $5.03
Challenge the High Side –Failure

Daily Continuous
Prices challenged the high side of the range before the storage release and then relaxed to decline into the “range”. I would expect similar trade to- day with the potential for additional weakness.
Major Support: $2.97, $2.727, $2.648,
Minor Support :
Major Resistance: $3.628, $3.86, $4.168, $4.461, $4.501, $4.551, $4.746-$4.75, $5.03