To read The Daily Call you must be a subscriber (Current members sign in here. ) Start your subscription today.
Author: Willis Bennett
Expectations of the “Rhyme”
To read The Daily Call you must be a subscriber (Current members sign in here. ) Start your subscription today.
Market Action “Rhymes”
To read The Daily Call you must be a subscriber (Current members sign in here. ) Start your subscription today.
First Indications Rhyming with 2014
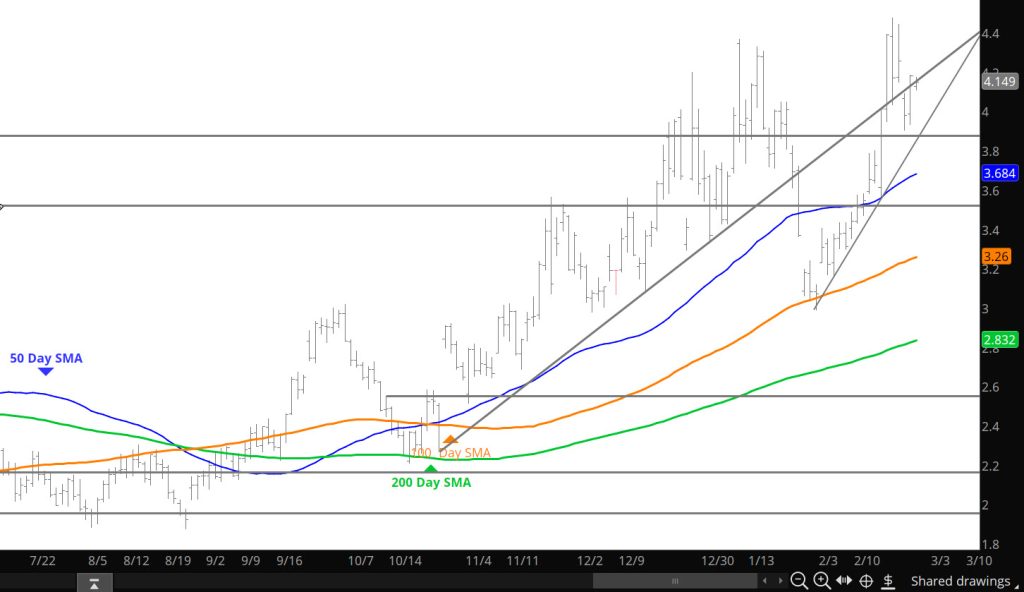
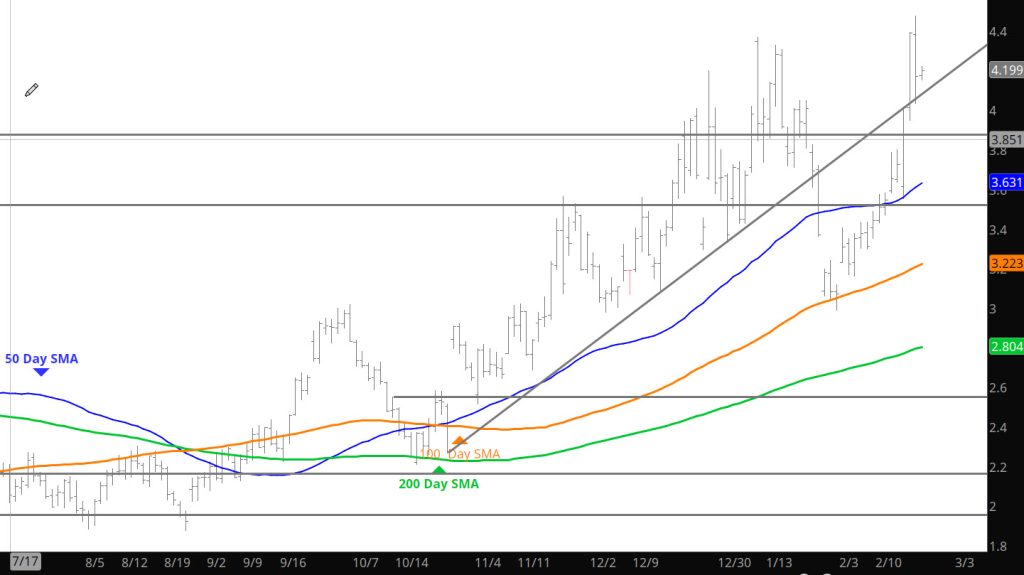
Daily Continuous
Not expecting the Jan high to be surpassed by the Feb high was using history to our benefit. Go into the recent history in the Weekly section — last week’s events have only happened a handful of times and the results are similar (especially in the last 12 years). Sure to the concepts of the Weekly writing — prices opened significantly lower on Sunday night. Won’t be claiming technical victory (got burned in the phases of the 2014 collapse) but will be watching the price movements closely this week.
Major Support:,$2.727-$2.784, $2.648, $2.39, $2.35, $2.112,
Minor Support : $4.16-$4.00, $3.34, $3.167, $3.00-$2.95, $2.914, $1.856,$1.89-$1.856
Major Resistance: $4.378-$4.394, $4.461,
Buying Dries Up
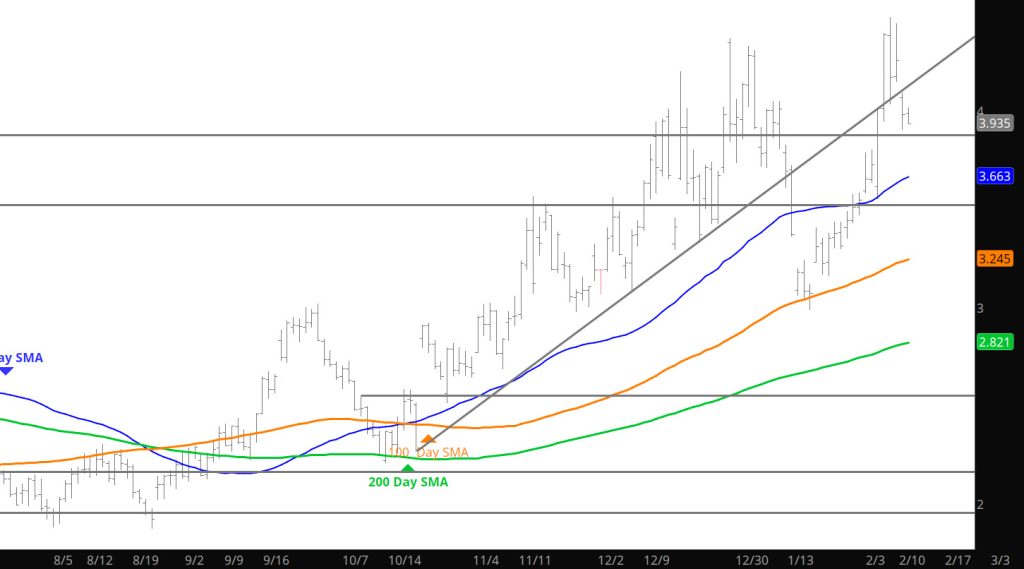
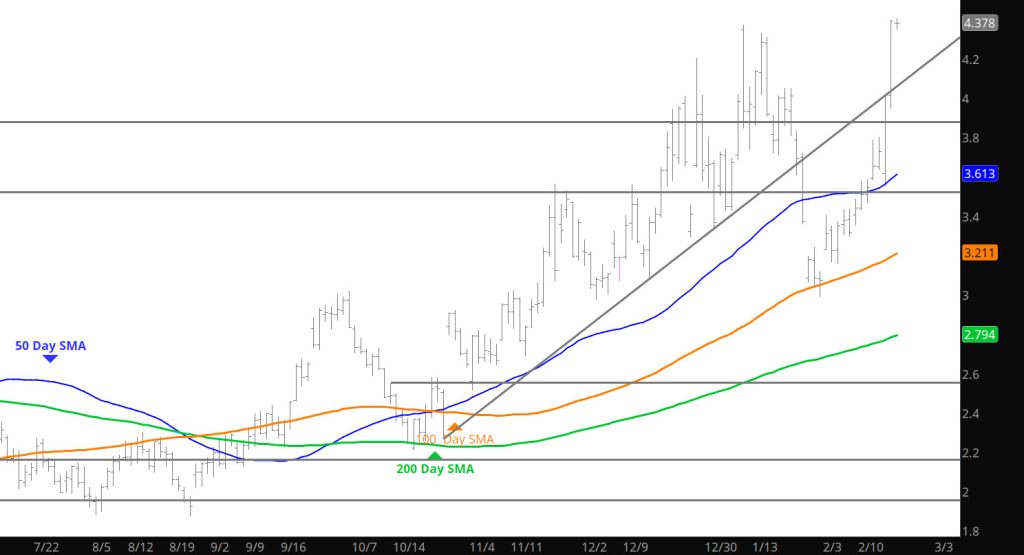
Daily Continuous
The run ran out of steam and retraced after the storage release which I thought was bullish miss. That is why I don’t follow trade on fundamental data. The declines did not break below $4 and now that seems to be support. There are four more trade days in the March contract, and the decline I was expecting (to major support at $3.16) seems unlikely. Should the market remains supported over the next days there may be a new “range” or para-dime in natural gas during 2025. This recent strength should be respected and I will follow up with additional analysis over the weekend.
Major Support:,$2.727-$2.784, $2.648, $2.39, $2.35, $2.112,
Minor Support : $3.34, $3.167, $3.00-$2.95, $2.914, $1.856,$1.89-$1.856
Major Resistance: $4.00, $4.201, $4.378-$4.394, $4.461,
Challenge at Resistance Succeeds For Now
To read The Daily Call you must be a subscriber (Current members sign in here. ) Start your subscription today.
Solid Run At Highs
To read The Daily Call you must be a subscriber (Current members sign in here. ) Start your subscription today.
Interesting Battle On Highs
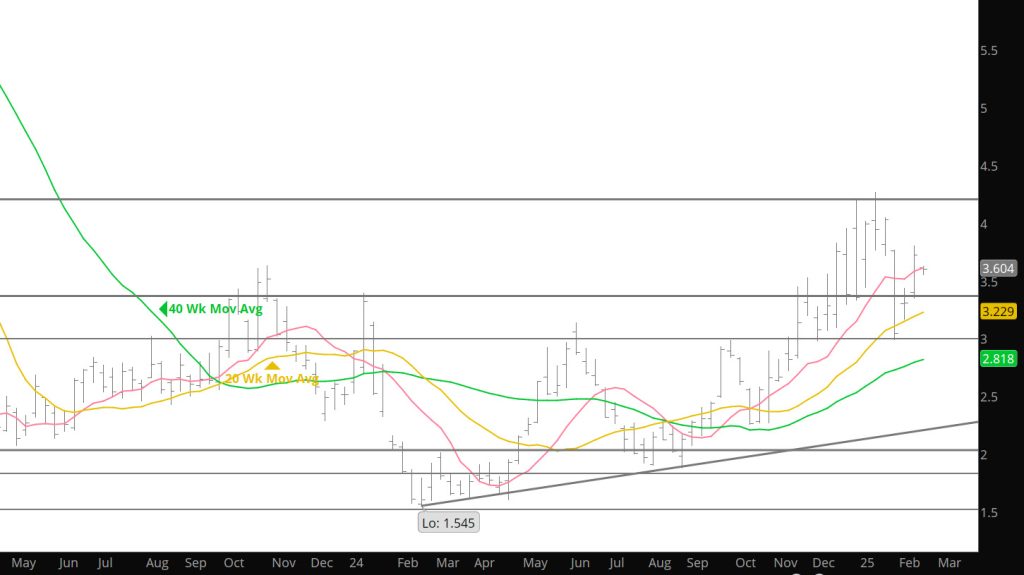
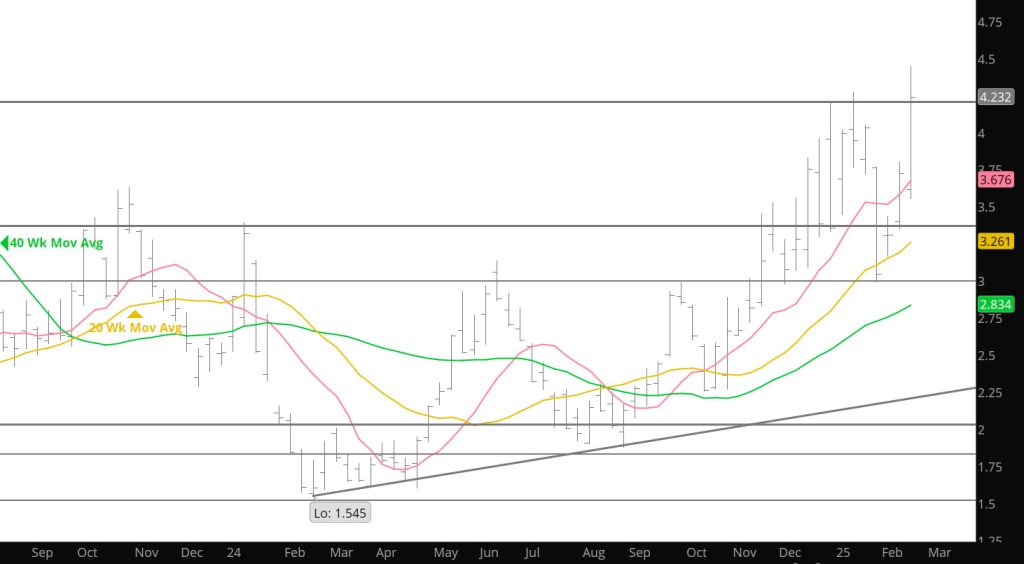
Weekly Continuous
Spoke repeatedly last week about the lack of a higher high for the March contract and the potential impact on the price run of late. Interestingly enough though, was the market closed on the highs of the Week (see chart above). In order to trade a higher high in Feb– the market will need to trade above the Jan high, and since 2009 the calendar January has been exceeded during February twice, 2014 and 2021. In the former the February high ($6.493) was not exceeded until January ’22. The 2021 February high ($3.316) was the high until the following June.
All the technical factors suggest that March will remain “inside” the range traded during January pending a retest of support presented by the December/January lows ($2.977 – $2.990). That said, the sponsorship that propelled March to an $.80/dt rally from the calendar January ending low was surprising.
On Thursday, more than a million contracts changed hands in the natural gas market with the prompt posting a daily gain of only $.063. The 50 – day SMA of volume is 600,638. A principle of technical analysis is that result must reflect effort…in my view it did not.
Over the history of natural gas trading there have not been very many days that volume was a million contracts or more, with 02/13/25 was the ninth time. All of the first eight either preceded or coincided with at least a moderately significant event. Should you be interested in the others send me an email and I will reply. It is also relatively rare for a volume spike to occur with natural gas in a definable range…and ever rarer that an increase in open interest accompanied the volume spike. A guess is that buyers were falling all over themselves to secure supplies when the collapse into and following February expiration was not extended…I think those outlooks will be corrected in the coming few days. Continue to expect the March contract closing the remainder of the gap left on 02/03 ($3. 118 – $3.161).
Major Support:,$2.727-$2.784, $2.648, $2.39, $2.35, $2.112,
Minor Support : $3.34, $3.167, $3.00-$2.95, $2.914, $1.856,$1.89-$1.856
Major Resistance: $3.829, $3.92, $4.00, $4.201, $4.378-$4.394, $4.461,
Light Volume Sends Prices Down
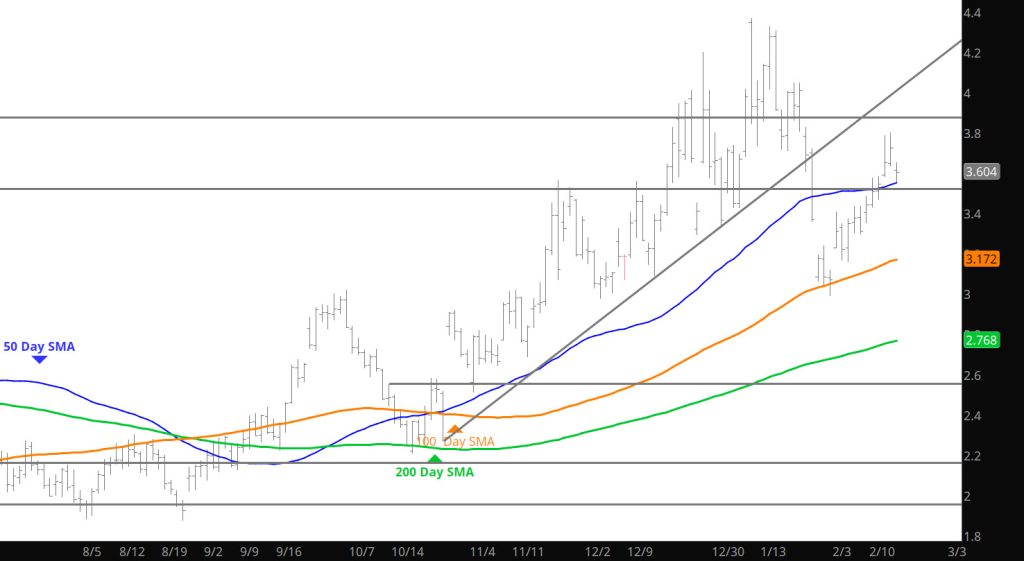
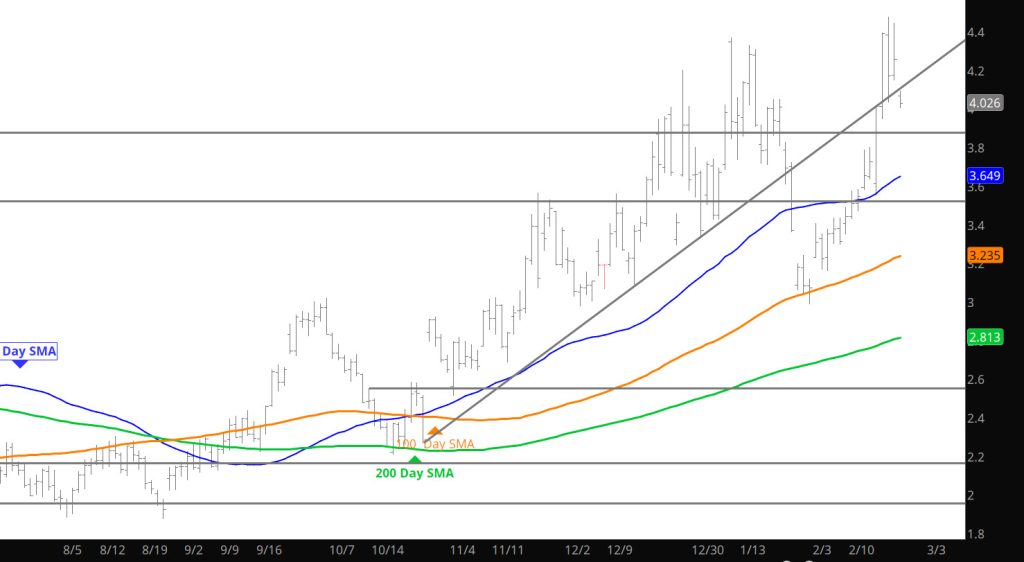
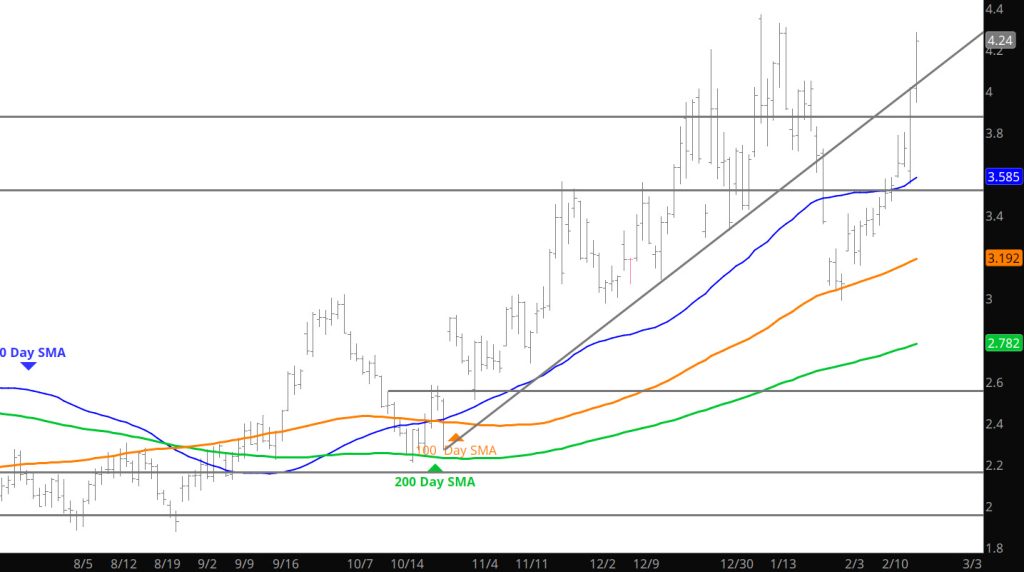
Daily Continuous
With the light trade on the holiday, prices retreated back down to conventional support from the 50day SMA. Went into expectations in the Weekly Section but from the Daily perspective — it’s the range controlling the trade.
Major Support:,$2.727-$2.784, $2.648, $2.39, $2.35, $2.112,
Minor Support : $3.34, $3.167, $3.00-$2.95, $2.914, $1.856,$1.89-$1.856
Major Resistance: $3.829, $3.92, $4.00, $4.201, $4.378-$4.394, $4.461,
Trying to Trade a Higher High
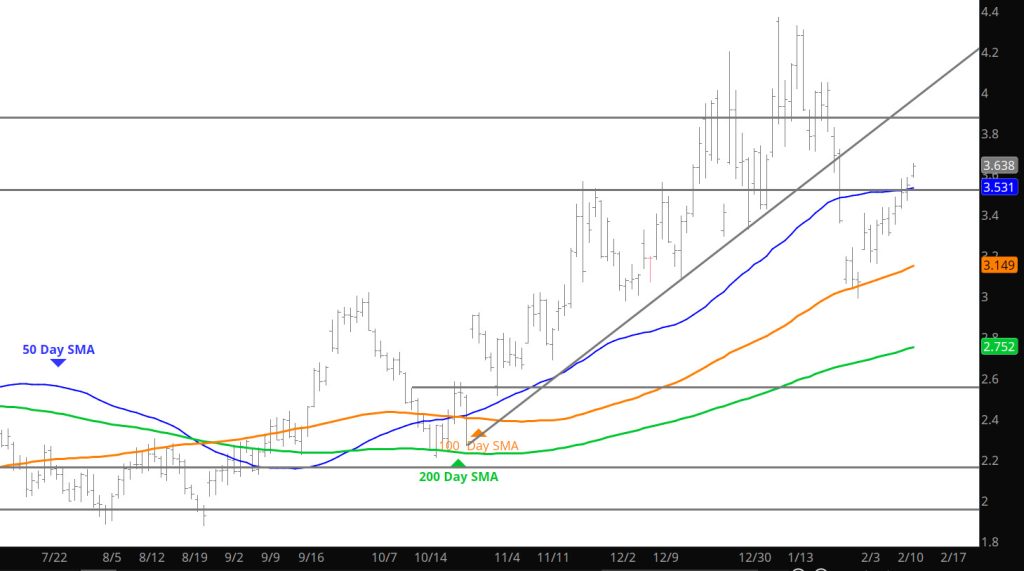
Daily Continuous
The move continued (especially in the late day trade) trying to entice the rally to take out the $3.84 area (not a higher high- monthly) but will lead to potential trade to set a higher monthly high– today is storage which may bring the volume to set a new high.
Major Support:,$2.727-$2.784, $2.648, $2.39, $2.35, $2.112,
Minor Support : $3.34, $3.167, $3.00-$2.95, $2.914, $1.856,$1.89-$1.856
Major Resistance: $3.829, $3.92, $4.00, $4.201, $4.378-$4.394, $4.461,