To read The Daily Call you must be a subscriber (Current members sign in here. ) Start your subscription today.
Author: Willis Bennett
Storage Release Confirms Declines
Daily Continuous
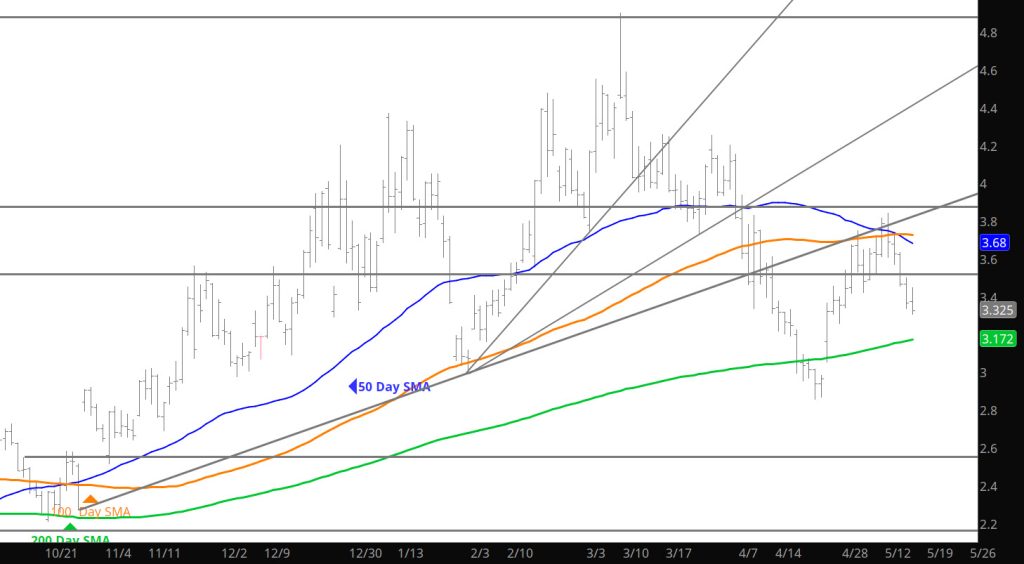
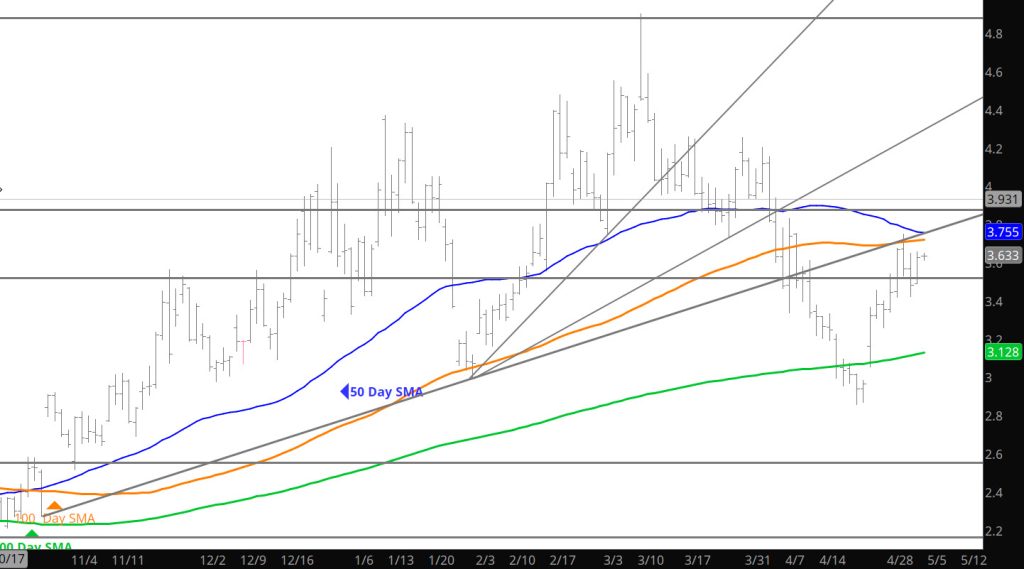
The slightly bearish storage data confirmed the near-term bias of declining prices. The Weekly close will be important for the near term price action but remember, we are still in a range for prices — just testing the low end of the range.
Major Support: $3.26, $2.97, $2.727, $2.648,
Minor Support :$3.423
Major Resistance: $3.628, $3.86, $4.168, $4.461, $4.501, $4.551, $4.746-$4.75, $5.03
Lows From Early May Challenged
To read The Daily Call you must be a subscriber (Current members sign in here. ) Start your subscription today.
Failure At Highs — Consolidation Continues

Daily Continuation
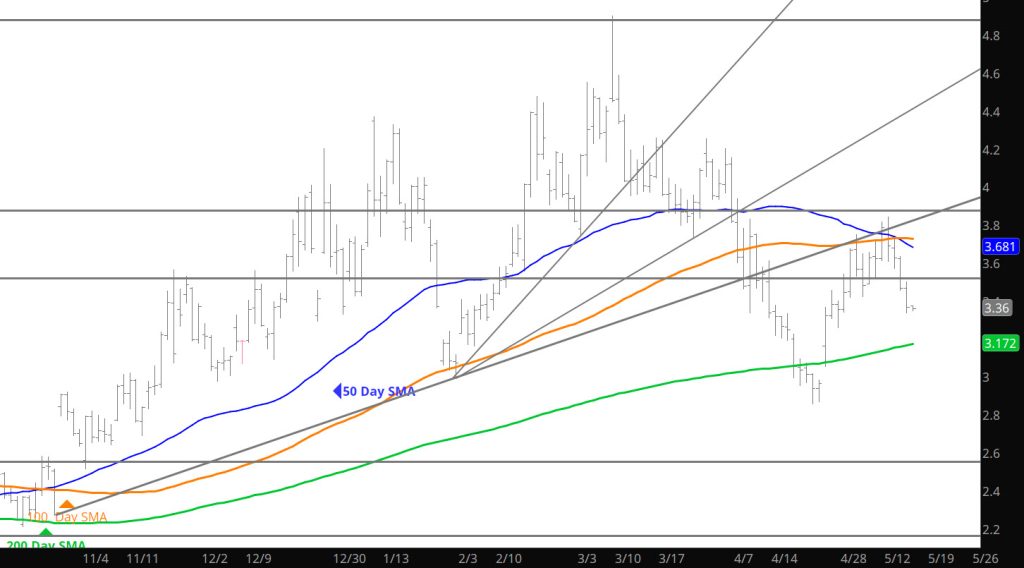
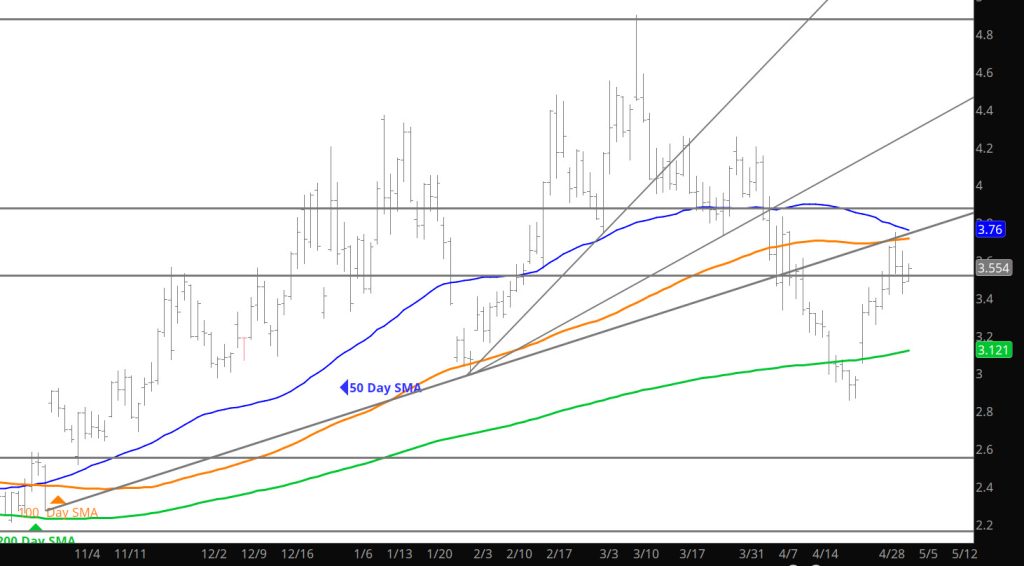
Price action rallied to a higher high only to feel the affect of altitude and retreated back into the comfort zone of the range for June gas. I would think that gas may make another run to the highs but it will need to close above the Moving averages converging just above yesterday’s close (see Daily Chart above) to catch some possible momentum.
Major Support: $2.97, $2.727, $2.648,
Minor Support :
Major Resistance: $3.628, $3.86, $4.168, $4.461, $4.501, $4.551, $4.746-$4.75, $5.03
Bullish End of Week
Daily Continuous
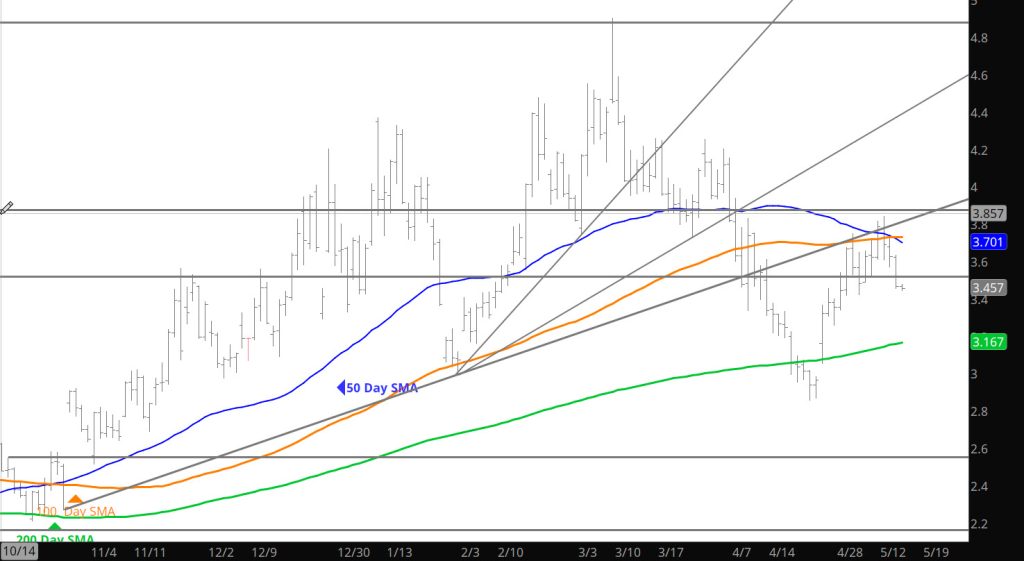
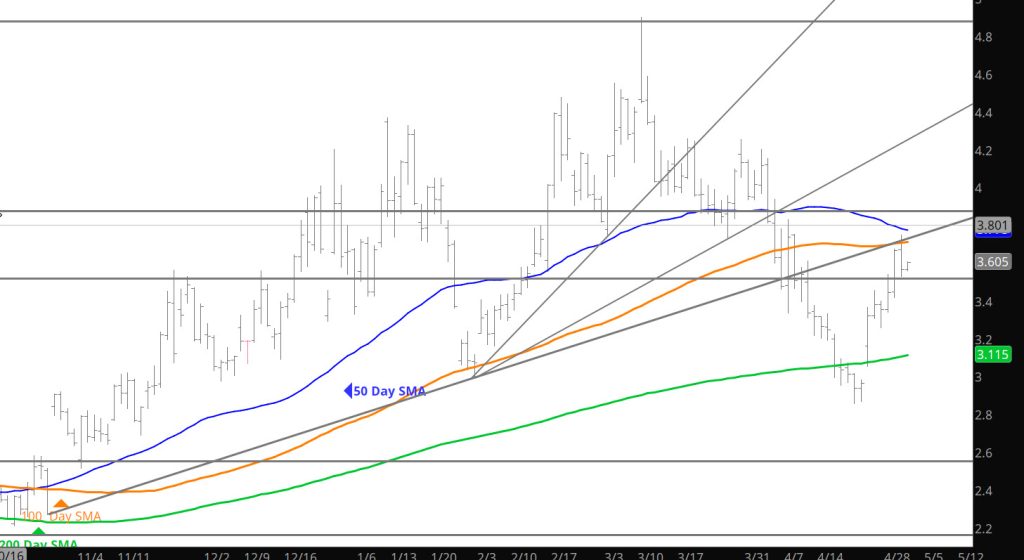
Discuss the price action in 2025 compared to previous years in the Weekly section, last week’s high close was a bullish indicator but consistent with history. Now, the issue is the continuance of the bias or failure at resistance, early Sunday night trade gives no insight.
Major Support: $2.97, $2.727, $2.648,
Minor Support :
Major Resistance: $3.628, $3.86, $4.168, $4.461, $4.501, $4.551, $4.746-$4.75, $5.03
Challenge the High Side –Failure

Daily Continuous
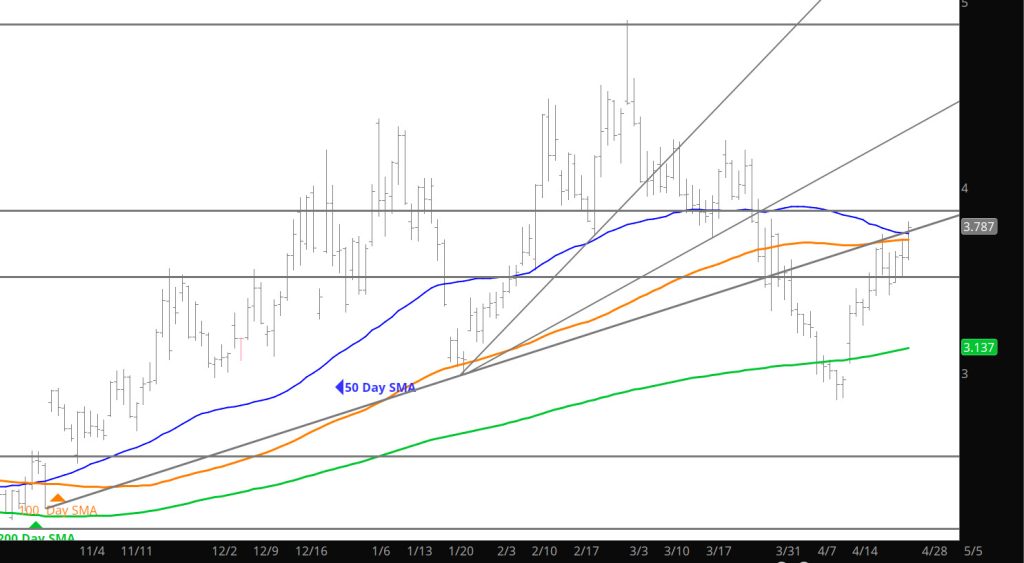
Prices challenged the high side of the range before the storage release and then relaxed to decline into the “range”. I would expect similar trade to- day with the potential for additional weakness.
Major Support: $2.97, $2.727, $2.648,
Minor Support :
Major Resistance: $3.628, $3.86, $4.168, $4.461, $4.501, $4.551, $4.746-$4.75, $5.03
Lets Go Top Side
To read The Daily Call you must be a subscriber (Current members sign in here. ) Start your subscription today.
Can’t Say Much During This Range Period
To read The Daily Call you must be a subscriber (Current members sign in here. ) Start your subscription today.
Range Testing Continues
Daily Continuation
Not a lot to add to the heading as the market is testing and establishing a range for near term price action– would play the further sides of support or resistance to avoid being chopped by the potential action.
Major Support: $2.97, $2.727, $2.648,
Minor Support :
Major Resistance: $3.628, $3.86, $4.168, $4.461, $4.501, $4.551, $4.746-$4.75, $5.03
Does It Build or Consolidate
Weekly Continuation
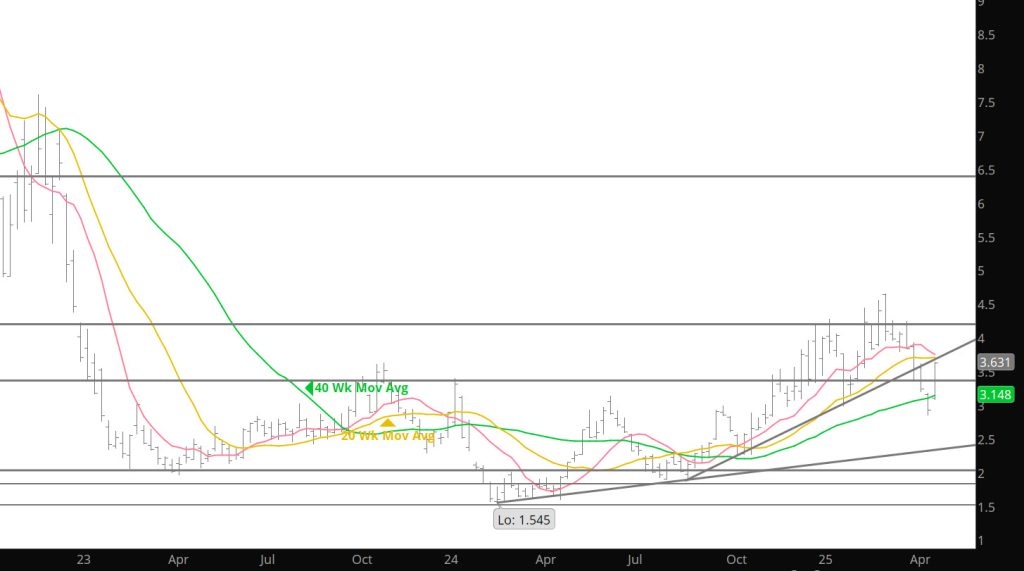
Last week’s rally was not among the things was not my immediate expectation. My view was that new prompt May would forfeit its premium and prompt gas offered lower to test rising trend line support and that technical “damage” done by the precipitous decline during calendar April (from a high on 04/03 at $4.203 to a 4/24 low at $2.858) including a weekly close below the December and January lows ($2.977 – $2.990) would render a significant recovery problematic at best.
The caveat was that in addition to vulnerability flowing from the persistent liquidation of open interest, prompt gas was severely short – term oversold and was two standard deviations below the 20 – weeks SMA for the first time in more than a year. As it worked out those conditions trumped the downside momentum that had built with six of seven lower weekly closes since the March high (the only exception was week ending 03/28 when new prompt May gained $.041). The weekly gain was the second largest for a prompt contract in more than a year ($.518 v $.565 for week ending 03/07) as June traded through layers of defined resistance as handily as it had violated similar levels of support.
Volatility…which can be a hedgers best friend or worst nightmare, increased this week.
Given the elevated level of volatility and this week’s range traded of $.814 (including the gap) it would be reasonable to expect increased volume. That did not happen. Average daily volume fell more than 25,000 contracts and the lowest of the week accompanied Friday’s .151 gain and strong close. Open interest did increase for the first time in four weeks but only modestly…+/- 10,000 contracts. Those are not the characteristics of a sustainable rally.
The rapidity and magnitude of this week’s gain left little definable support, June’s April low ($3.007) and the calendar April low and the low of week ending 05/02 ($2.858 – $2.859), but there is a ton of identifiable resistance including the 20 – week SMA…which as of late prompt gas seems to swing to extremes around. The 20 – week is currently $3.732. A few weeks ago, the solution for dealing with a persistent elevated level of volatility (the weekly ATR is $.587 and has been $.50/dt/week or higher since the beginning of ‘25/. In early May ‘24 it was $.306),
Major Support: $2.97, $2.727, $2.648,
Minor Support :
Major Resistance: $3.628, $3.86, $4.168, $4.461, $4.501, $4.551, $4.746-$4.75, $5.03