To read The Daily Call you must be a subscriber (Current members sign in here. ) Start your subscription today.
Author: Willis Bennett
Boring
To read The Daily Call you must be a subscriber (Current members sign in here. ) Start your subscription today.
Stalled
To read The Daily Call you must be a subscriber (Current members sign in here. ) Start your subscription today.
Bearish Storage–Prices Decline–Momentarily
To read The Daily Call you must be a subscriber (Current members sign in here. ) Start your subscription today.
Nothing To Add
Daily Continuous
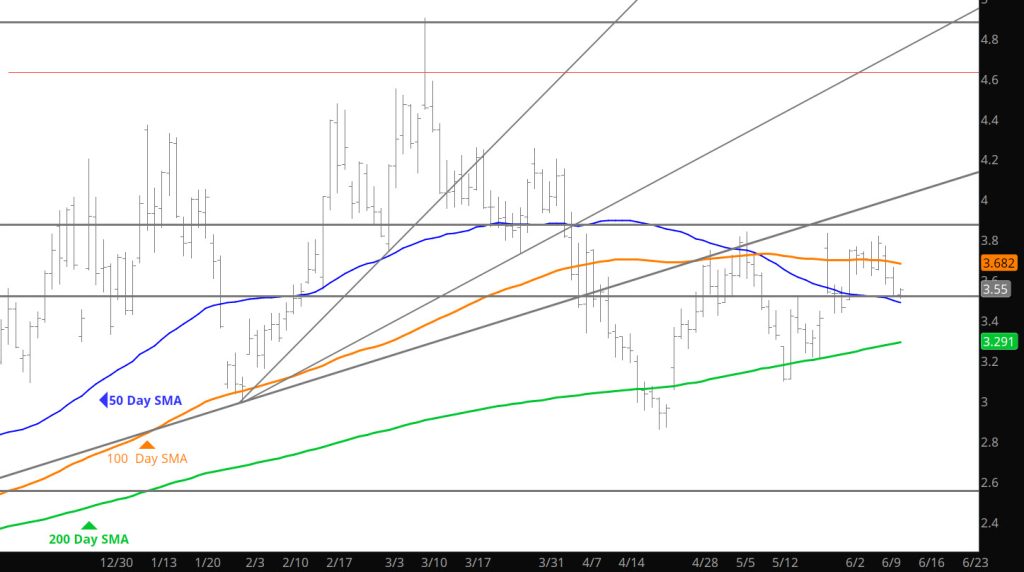
Can not add to the previous three Daily’s nor the Weekly on Monday.
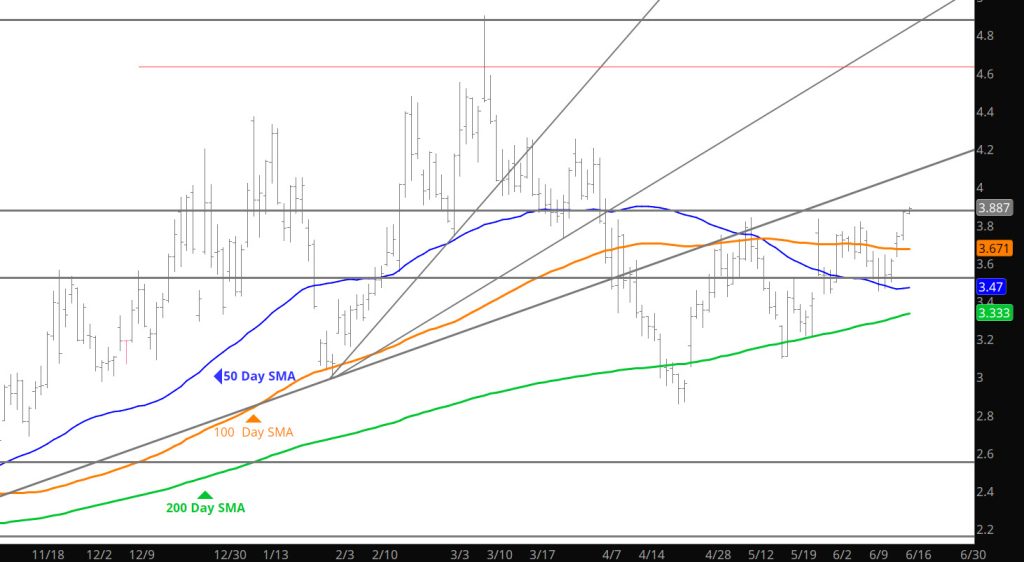
Major Support: $3.054-$3.007, $2.97, $2.727, $2.648,
Minor Support :$3.46, $3.30-$3.26
Major Resistance: $3.628, $3.86, $4.168, $4.461, $4.501
As Expected

Daily Continuous
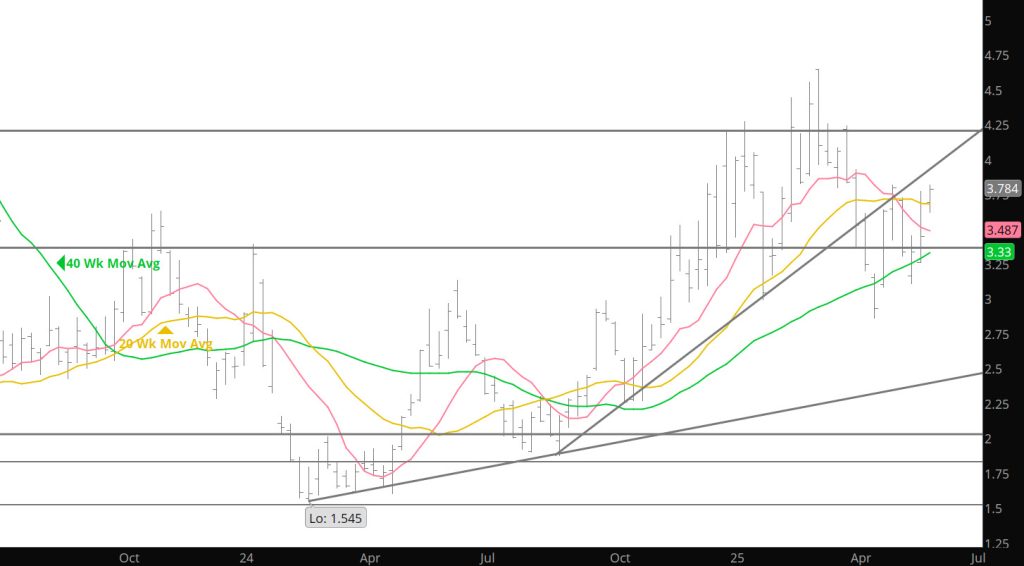
Not much to add from the last few week as the market seems to be comfortable with the range that the trade has developed. Prices going nowhere slowly– this market needs a fundamental jolt — either way.
Major Support: $3.054-$3.007, $2.97, $2.727, $2.648,
Minor Support :$3.46, $3.30-$3.26
Major Resistance: $3.628, $3.86, $4.168, $4.461, $4.501,
Rambling Through the Range
To read The Daily Call you must be a subscriber (Current members sign in here. ) Start your subscription today.
Ranging Along — Now Near Resistance
To read The Daily Call you must be a subscriber (Current members sign in here. ) Start your subscription today.
Bearish Storage Report
Daily Continuous
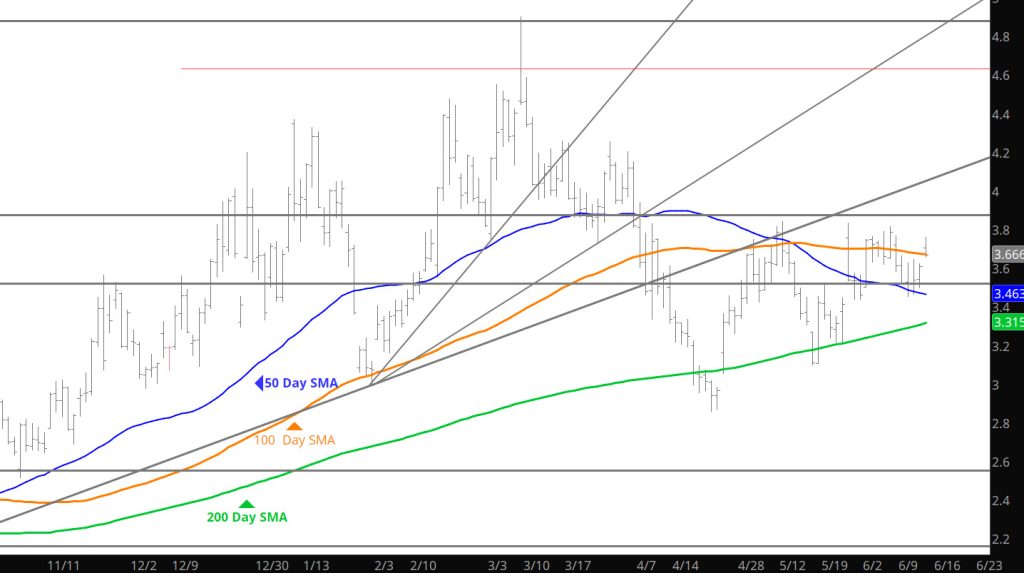
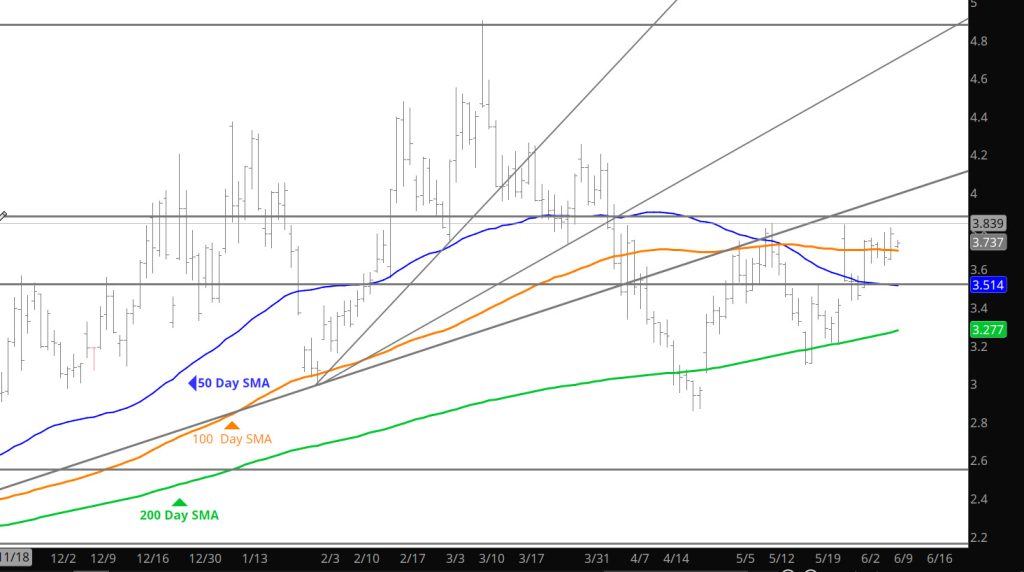
The market got a bearish storage release, sending prices down, but didn’t pressure the low side of the range before it got a footing and held the declines. Still in the range.
Major Support: $3.054-$3.007, $2.97, $2.727, $2.648,
Minor Support :$3.30-$3.26
Major Resistance:$3.46, $3.628, $3.86, $4.168, $4.461, $4.501,
Still Working the High End of Range

Daily Continuous
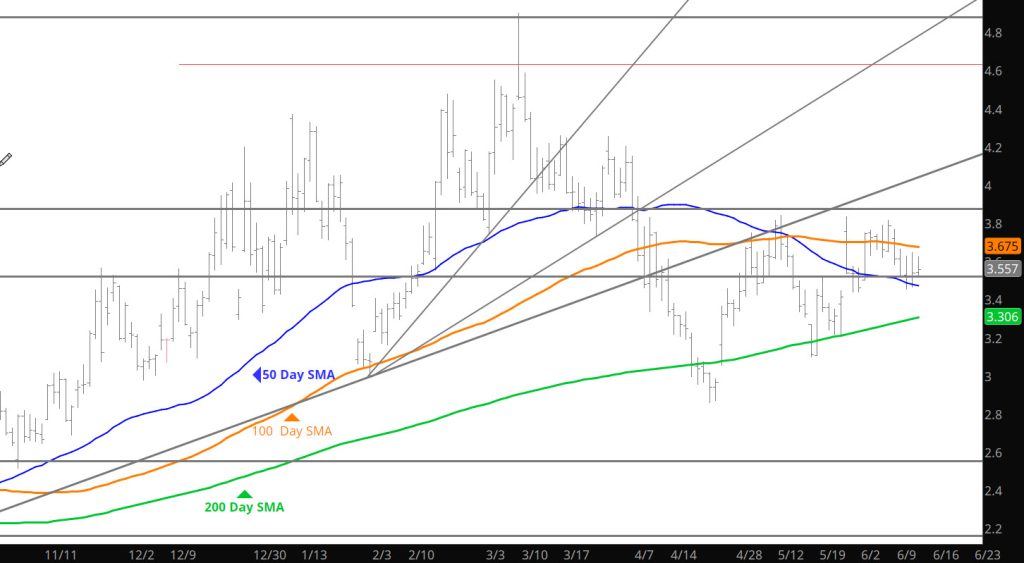
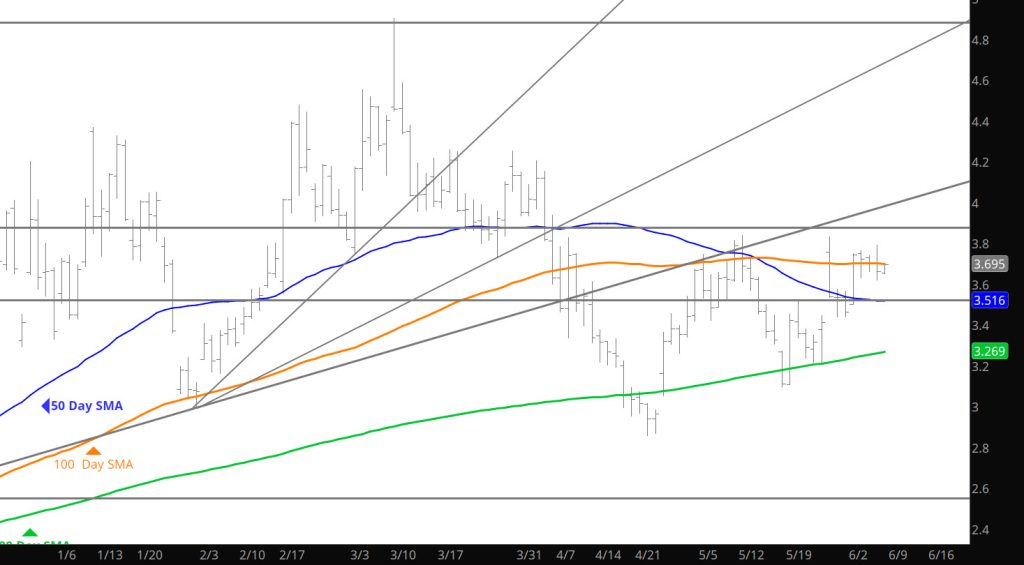
Can’t add anything that has not been mentioned here or in the Weekly section on Monday. Nothing has prompted prices to test the high levels from May at $3.83 but by the same token nothing has made trade interested in selling the recent gains. Perhaps the storage release will provide more interest in driving short term bias.
Major Support: $3.054-$3.007, $2.97, $2.727, $2.648,
Minor Support :$3.30-$3.26
Major Resistance: $3.628, $3.86, $4.168, $4.461, $4.501,