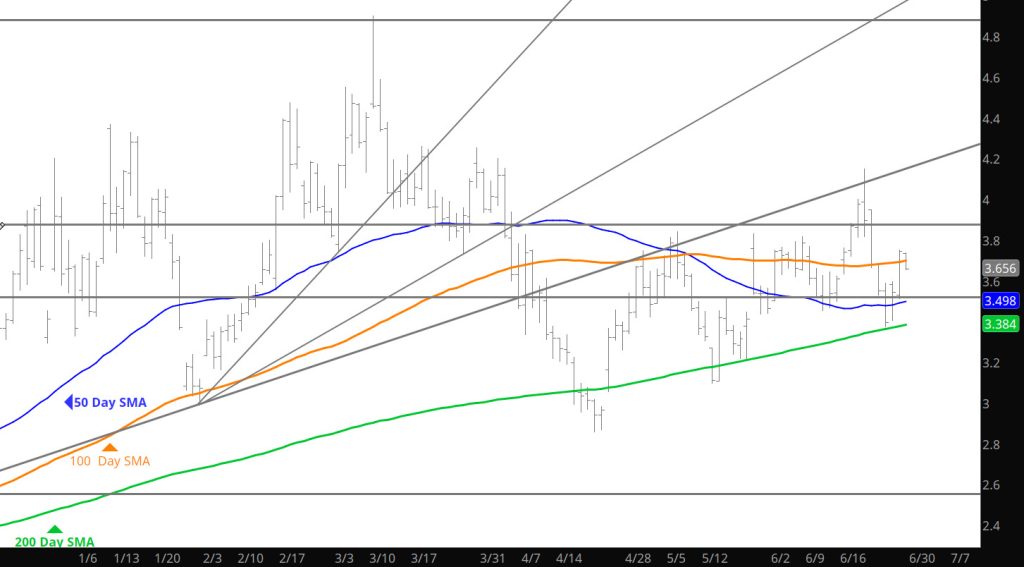
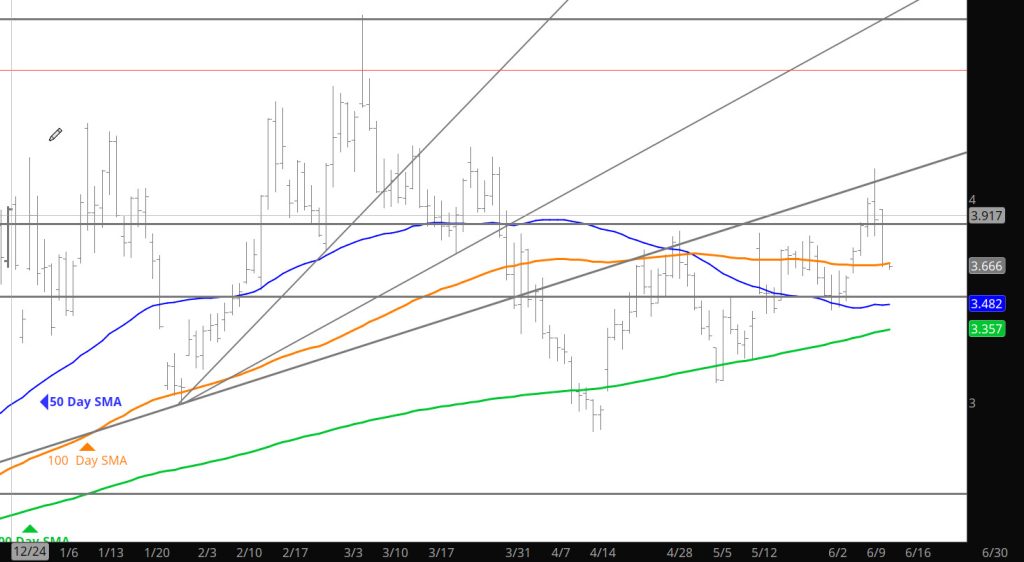
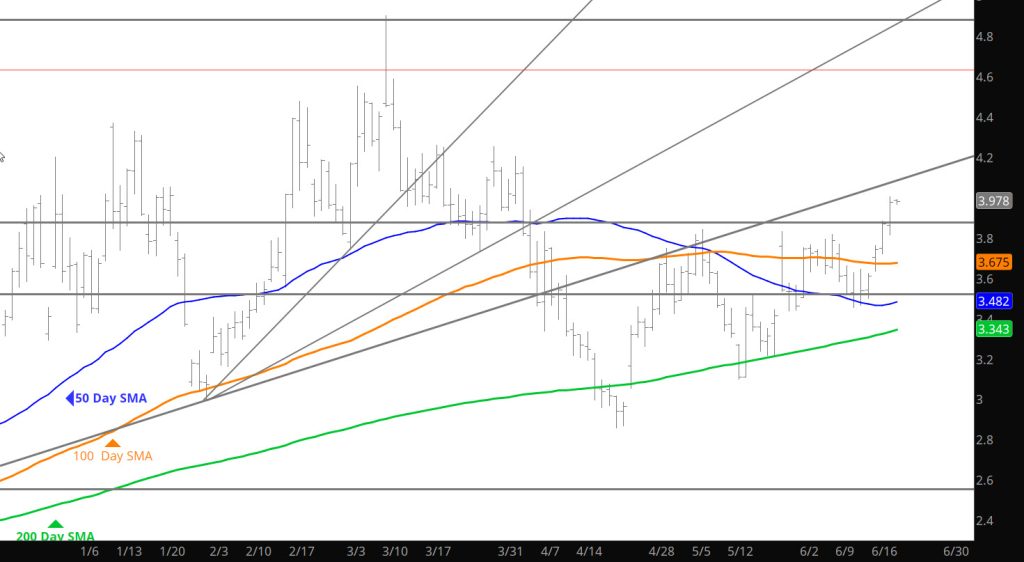
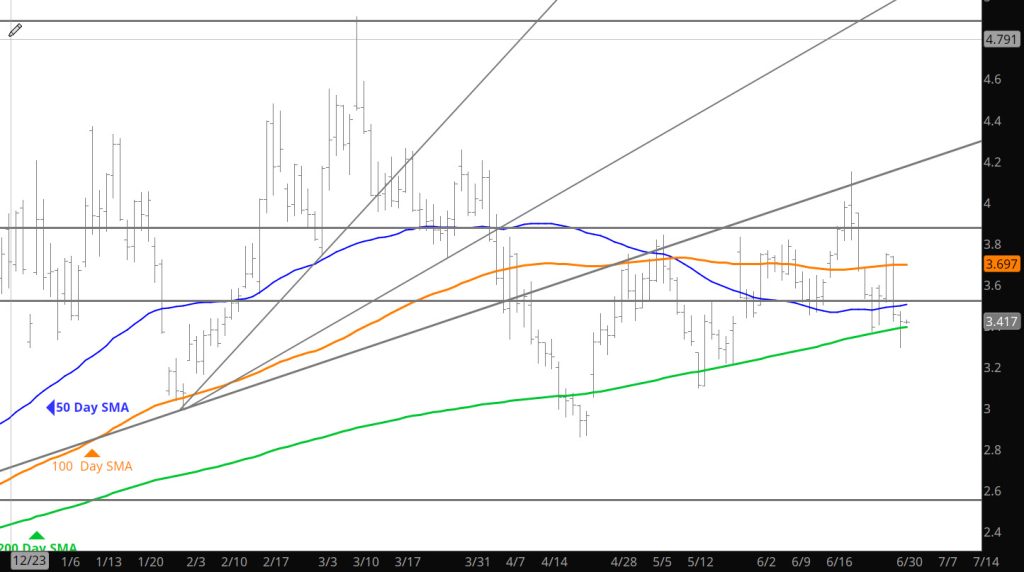
Historical Trend Seems to Continue

Weekly Continuous

First Off– will not be posting next week and will have sporadic Daily updates as I am traveling into northern Ontario Canada, which maintains limited internet access.

It looks like the market wants to challenge the low end of the trading range for the September contract. There seems to be no momentum to take prices back up to the failure of last week at $2.30. That behavior will likely continue during the remainder of the September contract. The almost always important 20 – weeks SMA is $2.243, the 40 – weeks is just above $2.300 and falling. In between is the zone between the low of week ending 07/12 and the high of the following week ($2.249 – $2.285) which was the terminal point of a rally attempt by then prompt August prompt. It is still August and the Q3 seasonal pressure should be expected to weigh on the gas market.

To read The Daily Call you must be a subscriber (Current members sign in here. ) Start your subscription today.

Run Ends at Several Resistance Levels

Daily Continuous

The price run ended yesterday at resistance levels from the lows of weeks ending 07/05 & 07/12 and the highs of weeks ending 07/19 & 07/26, $2.249 – $2.270 – $2.285 -$2.315. During the upcoming run into the annual Q4 highs this area will provide significant importance to any run.

Major Support:, $1.848, $1.52-$1.511, $1.481, $1.312
Minor Support : $2.00, $1.967- $1.94
Major Resistance:$2.18, $2.25-$2.310, $2.39, $2.44-$$2.502, $2.618, $3.00, $3.16

To read The Daily Call you must be a subscriber (Current members sign in here. ) Start your subscription today.

Strength Continues and Closes Above Initial Resistance

Daily Continuous

Action held firm for the day and closed above the initial resistance at $2.18. Storage comes out tomorrow so interest will be how the market trades and settles during the potential (light) volatility day.

Major Support:, $1.848, $1.52-$1.511, $1.481, $1.312
Minor Support : $2.00, $1.967- $1.94
Major Resistance:$2.18, $2.39, $2.44-$$2.502, $2.618, $3.00, $3.16

To read The Daily Call you must be a subscriber (Current members sign in here. ) Start your subscription today.

Yesterday All Over Again

Daily Continuous

Did you read yesterday’s Daily? Let me remind you… After extending gains to test the 100 day SMA, traders backed off the positive momentum of price action to consolidate at the days low. While not breaking out above– it will be today’s trade to see if prices are just going to decline and retest the recent support zones a dime around $2.00. The historical tendency for September has been to trade the high of its tenure during the first two weeks of the calendar month but there have been a few strong Augusts in recent years. A year ago, September conformed to the historical tendency. After falling to forfeit about a dime premium that had been awarded over expired August September ‘23 rallied from an 08/02 low ($2.457) to an 08/09 high ($3.018). In ’20, ’21 and ’22 September remained well – bid into expiration. This action was set up only to give back a chunk of those gains during calendar September (the Labor Day seasonal largely responsible).

To read The Daily Call you must be a subscriber (Current members sign in here. ) Start your subscription today.

Brief Consolidation of Recent Gains

Daily Consolidation

After extending gains to test the 100 day SMA, traders backed off the positive momentum of price action to consolidate at the days low. While not breaking out above– it will be today’s trade to see if prices are just going to decline and retest the recent support zones a dime around $2.00. The historical tendency for September has been to trade the high of its tenure during the first two weeks of the calendar month but there have been a few strong Augusts in recent years. A year ago, September conformed to the historical tendency. After falling to forfeit about a dime premium that had been awarded over expired August September ‘23 rallied from an 08/02 low ($2.457) to an 08/09 high ($3.018). In ’20, ’21 and ’22 September remained well – bid into expiration. This action was set up only to give back a chunk of those gains during calendar September (the Labor Day seasonal largely responsible).

Major Support:, $1.848, $1.52-$1.511, $1.481, $1.312
Minor Support : $2.00, $1.967- $1.94
Major Resistance:$2.18, $2.39, $2.44-$$2.502, $2.618, $3.00, $3.16

To read The Daily Call you must be a subscriber (Current members sign in here. ) Start your subscription today.

Running Into Support

Daily Continuous

Several attempts over the last ten days have attacked the support provided by the earlier lows of calendar 2024. None of which have proven successful. There will come a time (not sure when) that the market chooses a different direction bias– seasonal pressures may delay such a flip but it will occur.

Major Support:, $1.848, $1.52-$1.511, $1.481, $1.312
Minor Support : $2.00, $1.967- $1.94
Major Resistance:$2.18, $2.39, $2.44-$$2.502, $2.618, $3.00, $3.16

To read The Daily Call you must be a subscriber (Current members sign in here. ) Start your subscription today.

First Technical Indication Of a Slight Bias Change

Weekly Continuation

After trading through a previous week’s low in each of the last seven weeks followed by settling lower in seven of the last eight, prompt gas held above the expiration lows of August and then reversed to close higher, which was the first higher weekly close since the Friday before the June high.

While September traded a new contract low (trading through its previous week’s low for the eighth straight week while falling from $3.193 to $1.882, trading as contract prompt it held above the 07/29 low. A reversal higher followed that extended through last week’s high (both on a continuation and contract basis) and did so with a significant increase in volume. September traded an “outside” week reversal. While it did not close above $2.149 (last week’s high) it was close at $2.143.

To read The Daily Call you must be a subscriber (Current members sign in here. ) Start your subscription today.

Solid Move Up to Initial Resistance

Daily Continuous

Finally got a little move up to initial resistance — it will be interesting to watch. Still bearish technical input and now all this should be characterized as a counter trend rally to test resistance.

Major Support:, $1.848, $1.52-$1.511, $1.481, $1.312
Minor Support : $2.00, $1.967- $1.94
Major Resistance:$2.18, $2.39, $2.44-$$2.502, $2.618, $3.00, $3.16

Weakness Prevails

Weekly Continuous

August gas fell into expiration as was expected. This makes it the seventh straight month (all of the expiration’s in calendar ’24) the prompt was amply offered into expiration and the fourth of those seven to trade the low of its tenure as prompt coincident with expiration.

New prompt September closed higher for two days after August was off the board, managing to close above some declining trend line resistance, but without volume confirming the recovery with a reversal following with increased volume (and a significant increase in open interest strongly suggesting heightened interest in shorting the new prompt). September traded new contract lows on Thursday and Friday, trading as low as low as $1.920 before ending the week $.084 lower (on a continuation basis prompt gas was .0$39 lower). August’s closing range before recovering raises the technical odds that September will get a shot to finish closing the gap. If September closes below $1.848 then the daily gap comes into focus ($1.628 – $1.85).

On May 1st total open interest was 1,587,270. By June 12th the total had fallen to 1,443,769 allowing for that nearly 150,000 contracts of short covering had been a significant contributor to the June 100%+ rally. Since 06/12 open interest has returned to and this week surpassed the early May high (currently 1,592,601). That total is less than 25,000 contracts below the twin peaks that preceded the February and March lows.

Give the downside momentum created by the multiple weeks decline from the June high, the expected weak expiration of August gas and September trading a new contract low, expect the prompt to be offered lower to close the late April gap. On a weekly continuation basis, the fraction of that gap remaining is between $1.848 and $1.856.

Longer term, these declines and the constant attack at rallies by the bears will lead to a short covering rally similar to what was experienced in early June. Perhaps, that will be the driver for the annual upcoming Q4 run.

Major Support:, $1.848, $1.52-$1.511, $1.481, $1.312
Minor Support : $2.00, $1.967- $1.94
Major Resistance: $2.39, $2.44-$$2.502, $2.618, $3.00, $3.16

Selling Begets Selling

Daily Continuous

The market is poised to test the lows from earlier in the spring (discussed in the Weekly) and is starting to add to the declines in the Sunday night trade. Not sure if the storm will impact prices as the potential for demand destruction was well known on Friday afternoon. Continue to expect the Q3 low to be established between now and Labor Day weekend.

Major Support:, $1.848, $1.52-$1.511, $1.481, $1.312
Minor Support : $2.00, $1.967- $1.94
Major Resistance: $2.39, $2.44-$$2.502, $2.618, $3.00, $3.16

To read The Daily Call you must be a subscriber (Current members sign in here. ) Start your subscription today.