To read The Daily Call you must be a subscriber (Current members sign in here. ) Start your subscription today.
Author: Willis Bennett
Light Sunday Trade Wants to Break $3.00
To read The Daily Call you must be a subscriber (Current members sign in here. ) Start your subscription today.
New Prompt Same Range–Maybe Lower
To read The Daily Call you must be a subscriber (Current members sign in here. ) Start your subscription today.
New Prompt — New Range?
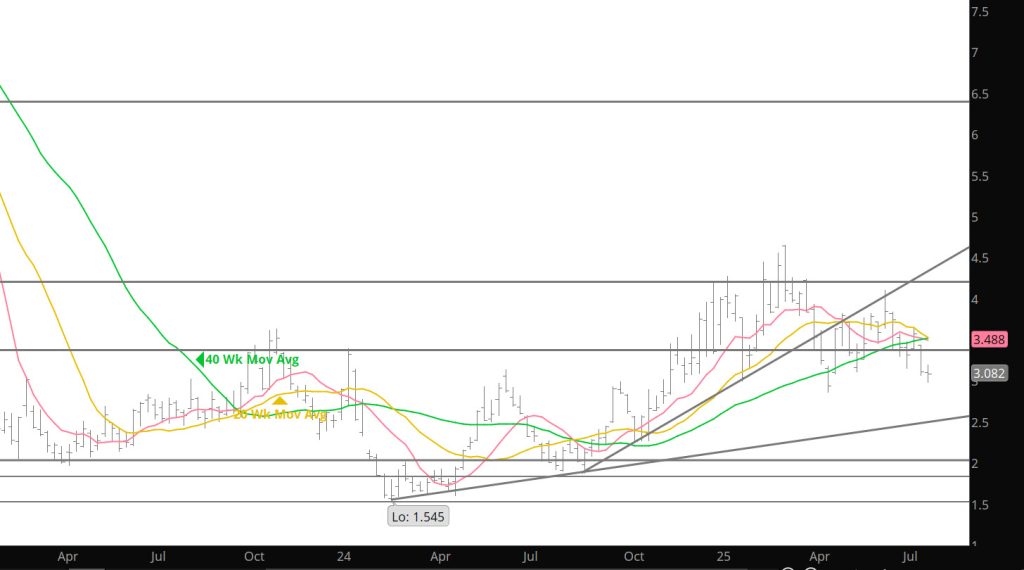
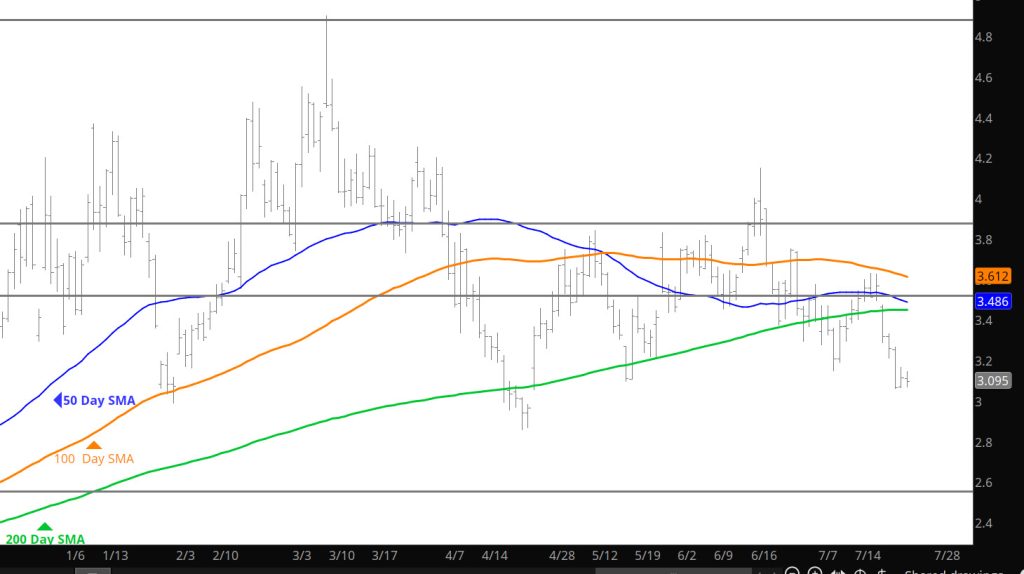
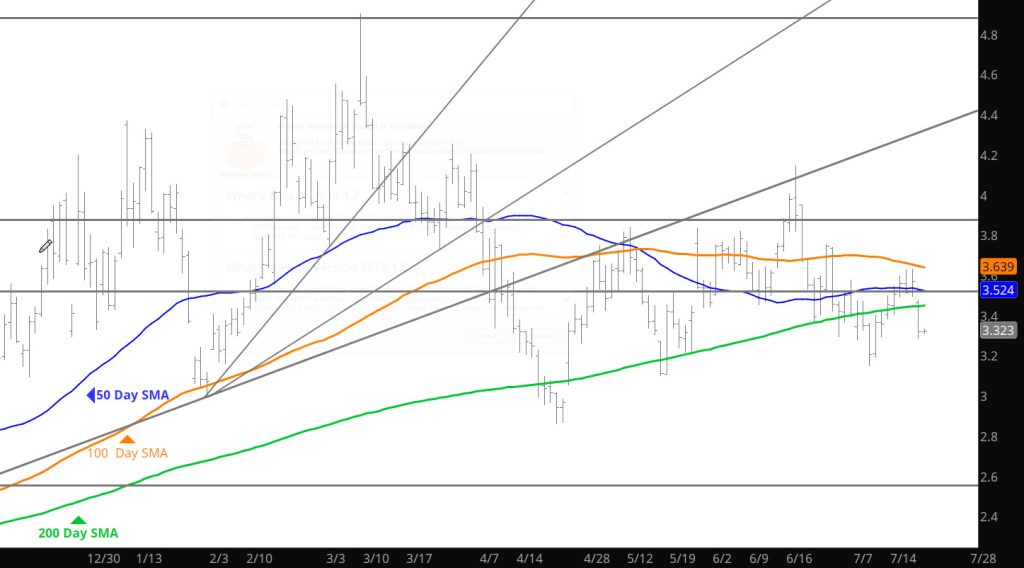
Daily Continuous
Expiration brought on a slight rally– we will have to wait for any follow through. We are at some lows maybe look to the winter months for long positions or prompt months for short postitions.
Major Support: $3.054-$3.007, $2.97, $2.727, $2.648,
Minor Support : $3.30-$3.26
Major Resistance:$3.25-$3.31,$3.39, $3.62, $4.168, $4.461, $4.501
Weakness Into Expiration Is the Recent Trend
To read The Daily Call you must be a subscriber (Current members sign in here. ) Start your subscription today.
Going To Keep Testing Lows
To read The Daily Call you must be a subscriber (Current members sign in here. ) Start your subscription today.
Rebound Off of Support Test
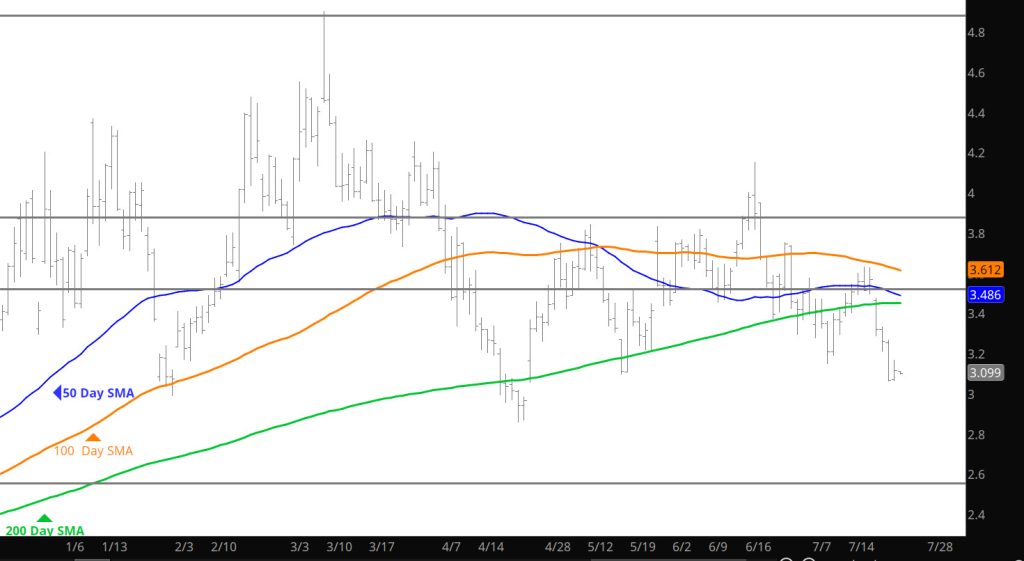
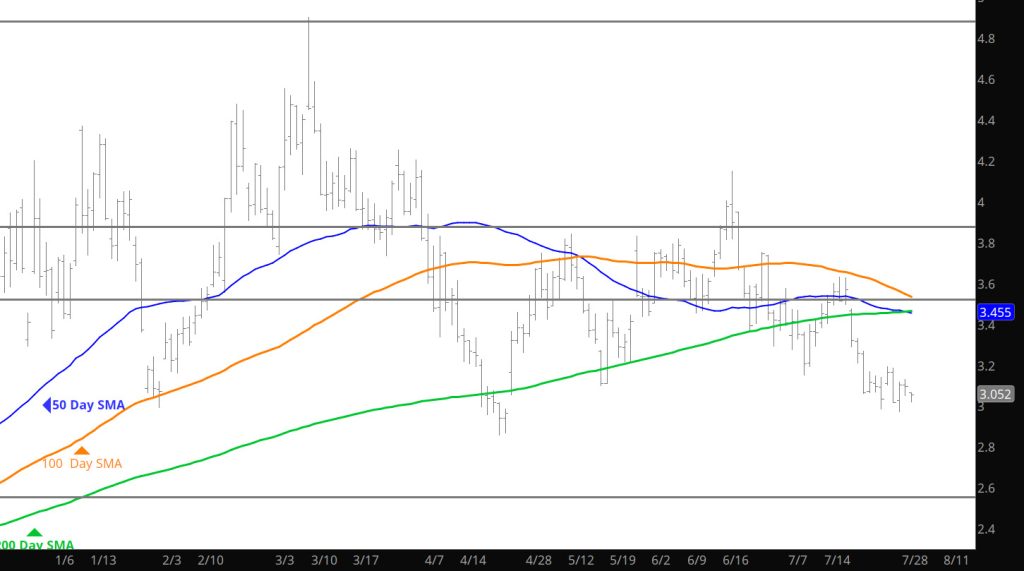
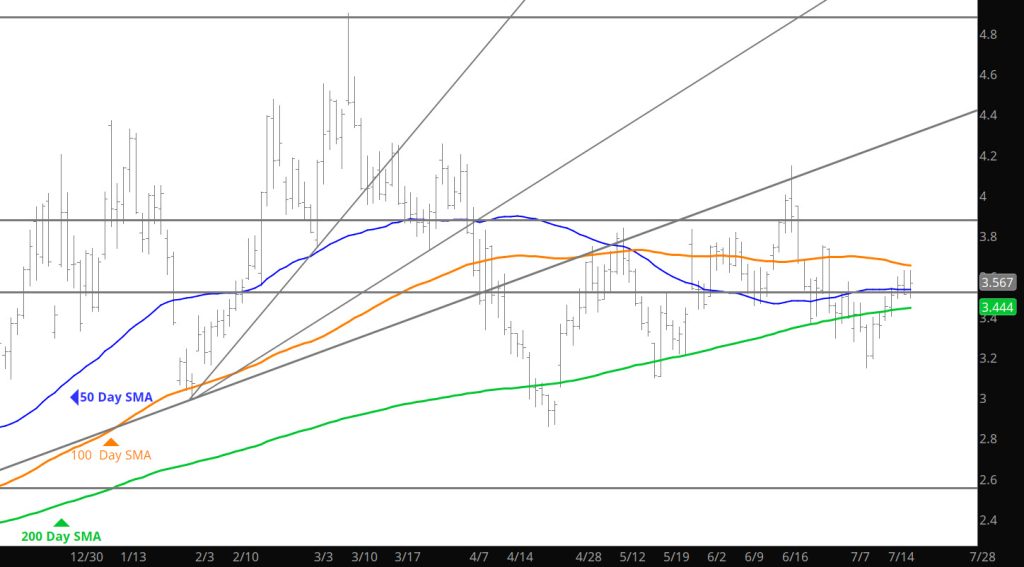
Daily Continuous
The declines neglected challenging the key support area and on the storage release rallied over $.10 but gave the gains up during the remaining trade. Still believe that any declines will be rejected at the support lows — that said would not load up on length.
Major Support: $3.054-$3.007, $2.97, $2.727, $2.648,
Minor Support $3.30-$3.26
Major Resistance:$3.16-$3.25, $3.43, $4.168, $4.461, $4.501
Testing the August Contract Lows
To read The Daily Call you must be a subscriber (Current members sign in here. ) Start your subscription today.
Testing August Low’s
To read The Daily Call you must be a subscriber (Current members sign in here. ) Start your subscription today.
Continue Lower
To read The Daily Call you must be a subscriber (Current members sign in here. ) Start your subscription today.