A Break Below — Mild Response

Daily Continuous

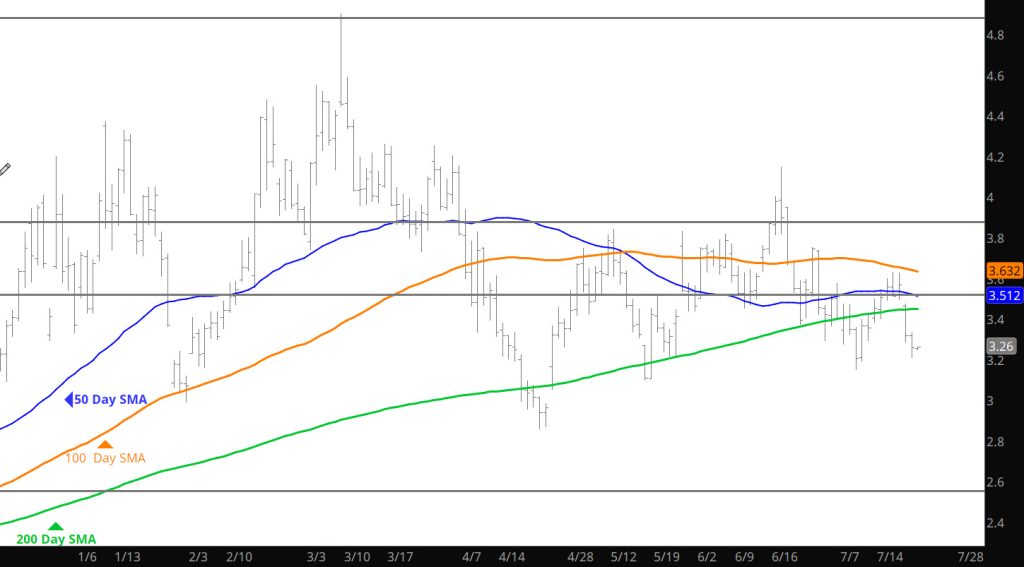
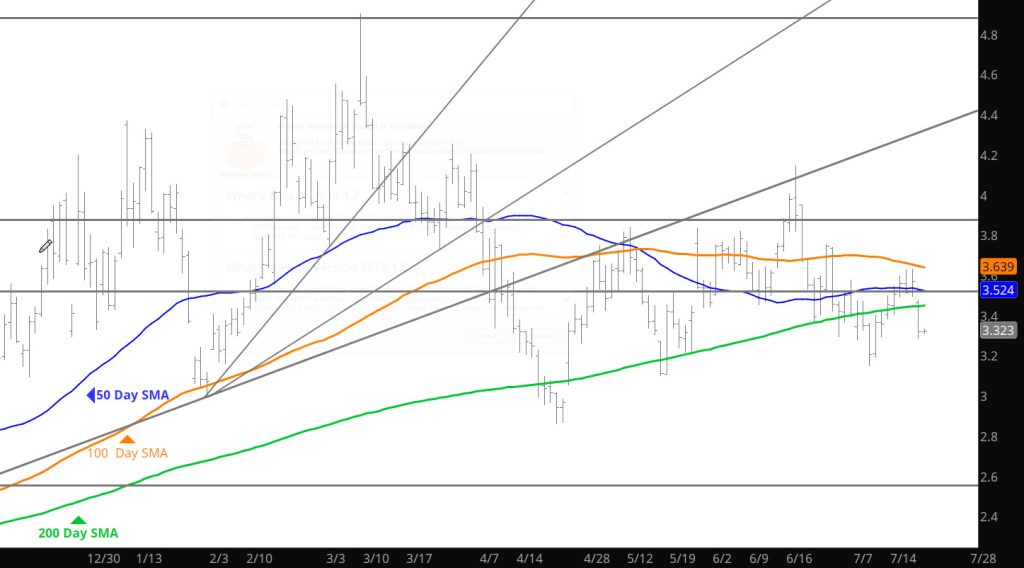
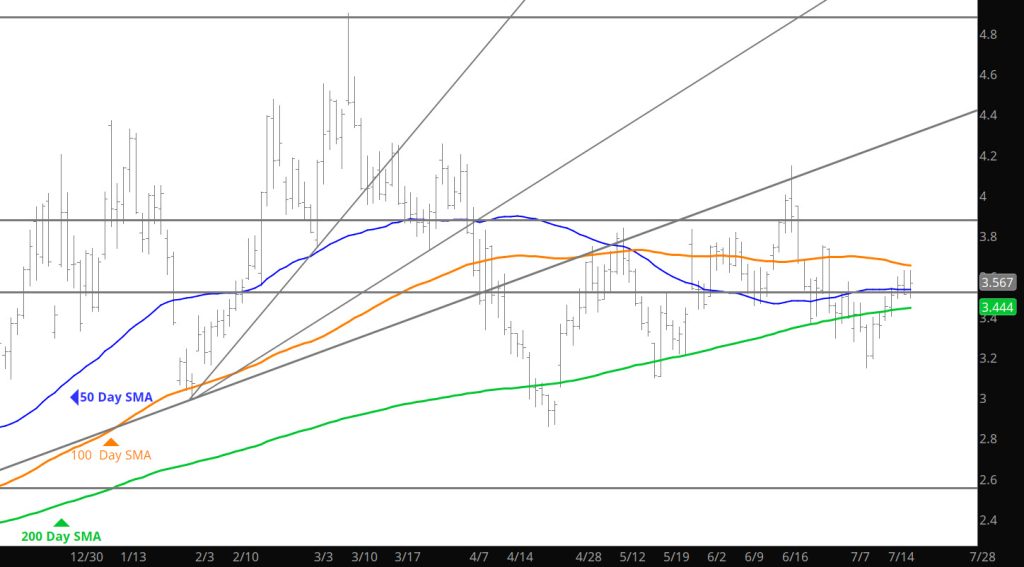
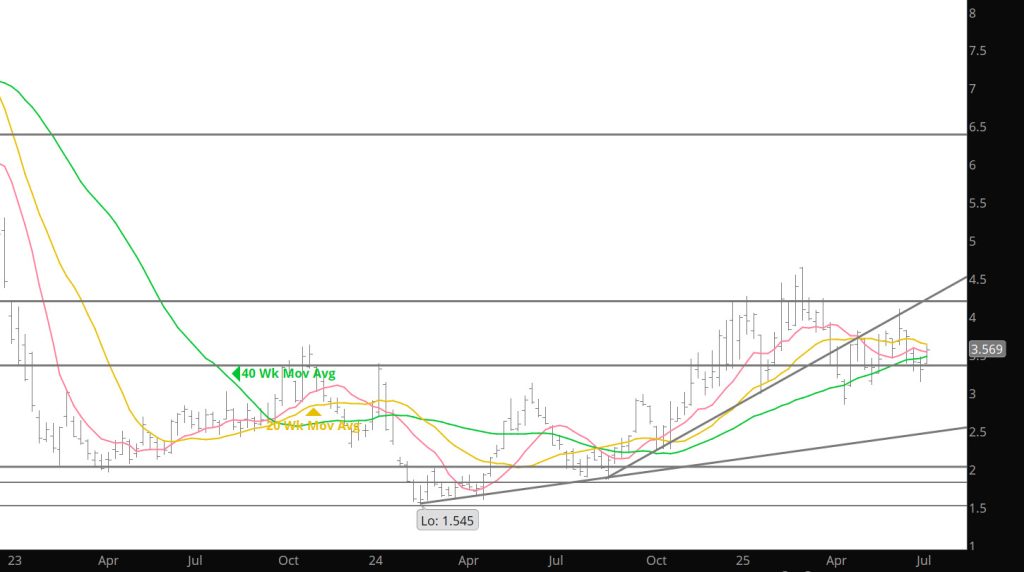
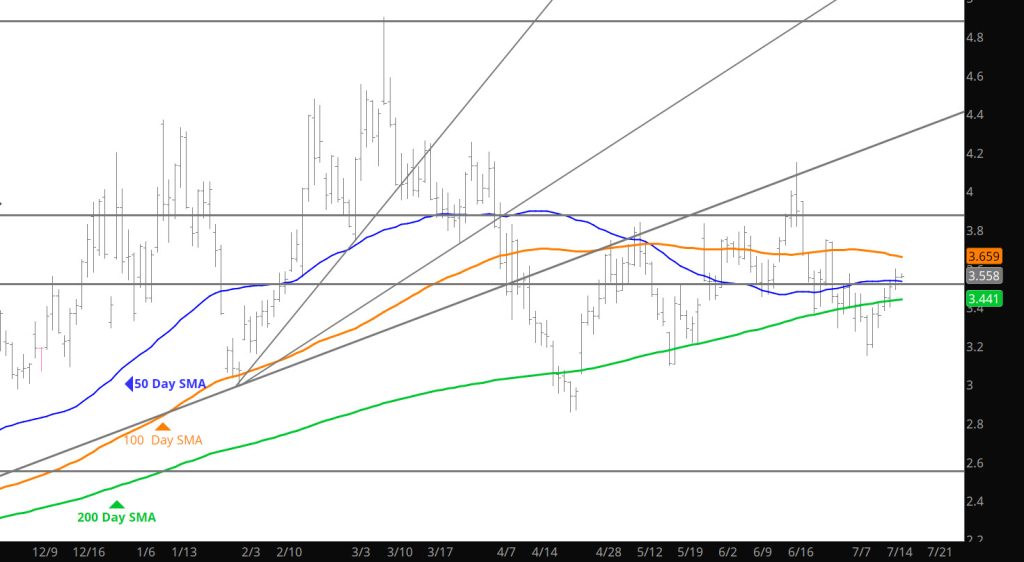
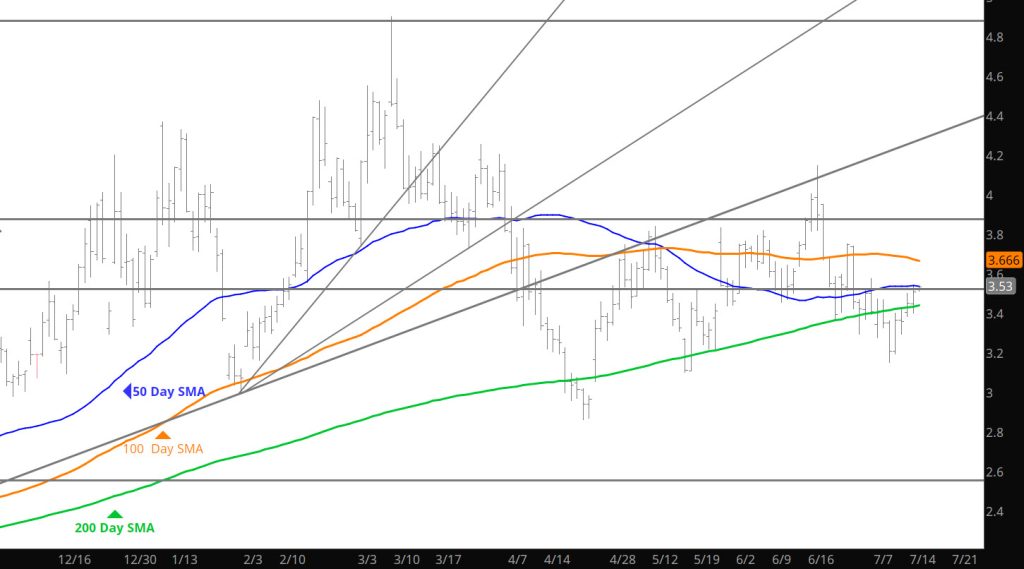
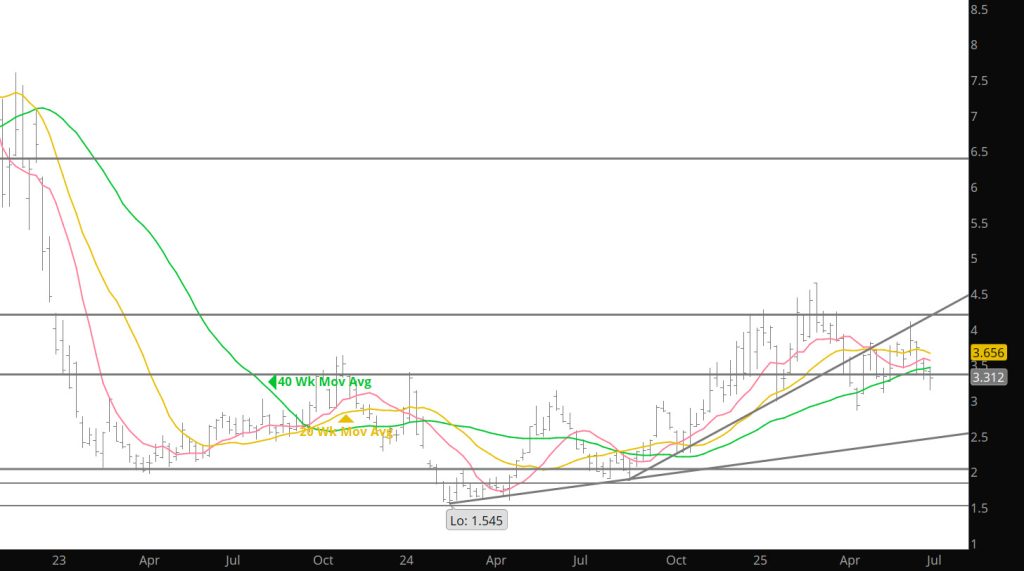
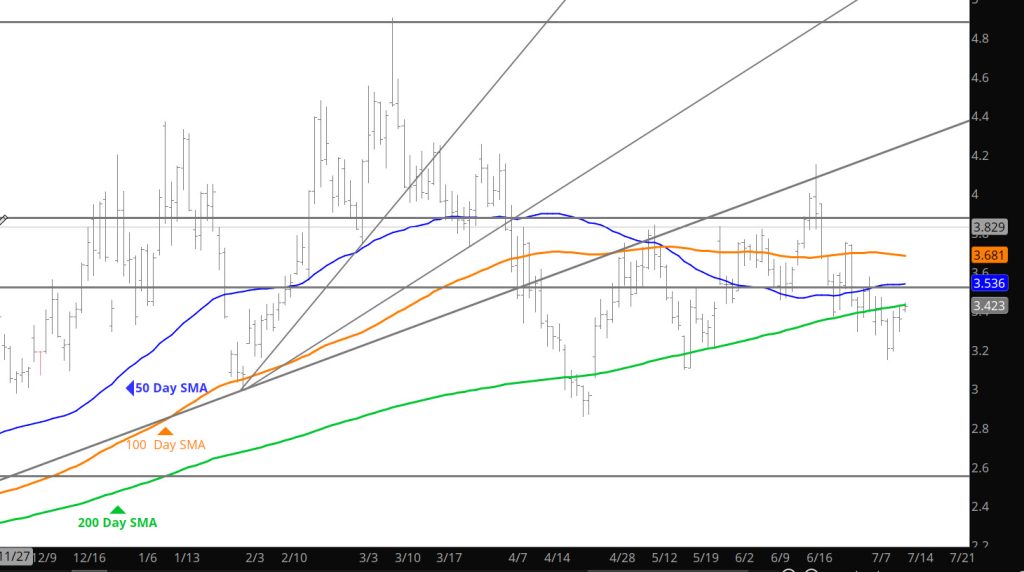
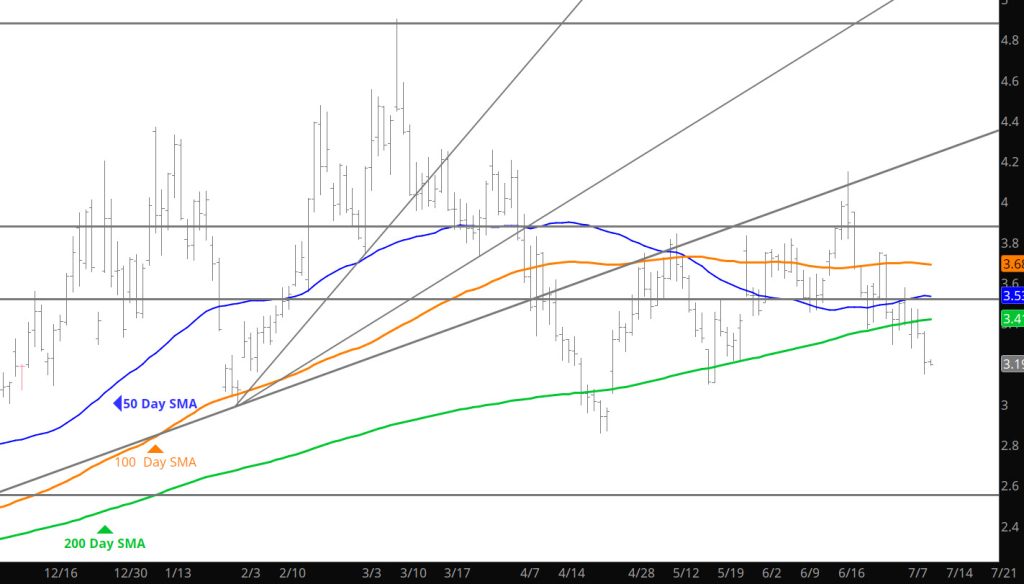
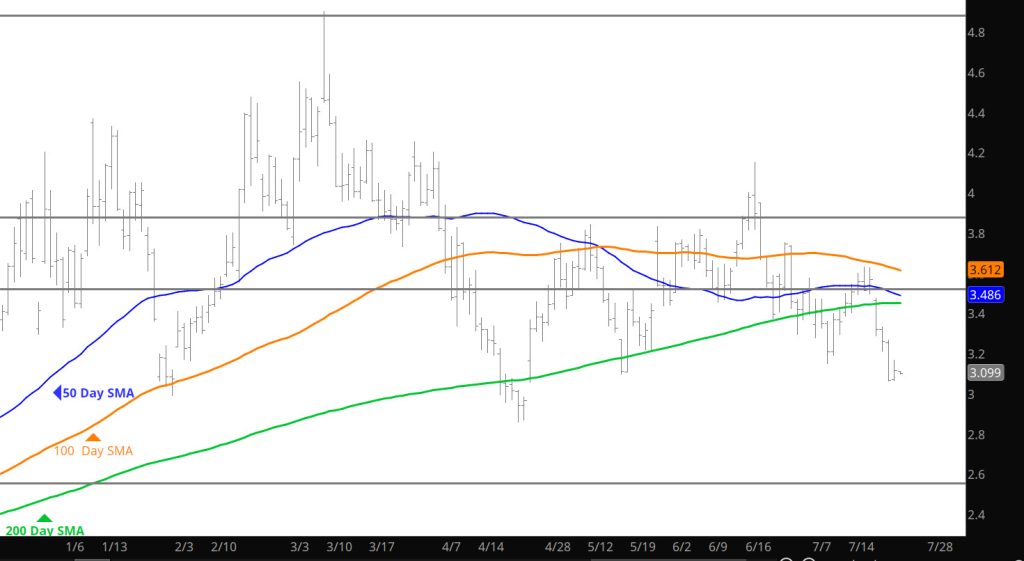
Prices broke below the $3.00 area but the response was rather moot. We may very well be developing a range for prices to trade the month with in. The next week should confirm that with a retracement upward today followed by declines next week. What do I call that — on yea — consolidation.

Major Support:, $1.595, $1.52-$1.511, $1.481, $1.312
Minor Support : $2.944, $2.64, $2.448, $2.168, $2.12, $2.00, $1.967- $1.94
Major Resistance:
$3.00, $3.16

To read The Daily Call you must be a subscriber (Current members sign in here. ) Start your subscription today.

Support Continues to Hold

Daily Continuous

For the second consecutive day, prices tested and held the support (old resistance) zone at $3.00. The storage report will likely provide yet another test today. The longer the zone holds the stronger it will get — so we will have to watch the zone over the next week. History tells us that the current price levels and the June (calendar) high may provide some relief for these tests.

Major Support:, $1.595, $1.52-$1.511, $1.481, $1.312
Minor Support : $3.00, $2.944, $2.64, $2.448, $2.168, $2.12, $2.00, $1.967- $1.94
Major Resistance:
$3.00, $3.16

To read The Daily Call you must be a subscriber (Current members sign in here. ) Start your subscription today.

Prices Rally –Support at Breakout Holds

Daily Continuous

Prices continued the gains from the close of Monday and set a new continuous high for natural gas. From the bullish standpoint the holding of support at old resistance ($3.00) a bullish development. From the bearish position the $3.00 level will need to break with a follow down to $2.84.

Major Support:, $1.595, $1.52-$1.511, $1.481, $1.312
Minor Support : $2.844, $2.64, $2.448, $2.168, $2.12, $2.00, $1.967- $1.94
Major Resistance:
$2.94, $2.97, $3.00, $3.16

To read The Daily Call you must be a subscriber (Current members sign in here. ) Start your subscription today.

Failure At Resistance — Failure Near Support

Daily Continuous

The run extended yesterday morning, setting a new recent high at $3.096, before serious selling took prices down, well below $3.00. From there, the market showed resilience as a rally into the close. From the close prices are still trading higher in the after-market back above $3.00. From the technical position — the action is consolidating whether the move above $3.00 will hold as support in the long run.

Major Support:, $1.595, $1.52-$1.511, $1.481, $1.312
Minor Support : $2.844, $2.64, $2.448, $2.168, $2.12, $2.00, $1.967- $1.94
Major Resistance:
$2.94, $2.97, $3.00, $3.16

To read The Daily Call you must be a subscriber (Current members sign in here. ) Start your subscription today.

Challenging Levels Not Seen For Months

Price closed above resistance level trend line (discussed in the Weekly section) and are challenging levels not seen since Jan at $3.00. Last week’s reversal of a reversal (also discussed in the Weekly) signals that the historical strength in prices during Jun is evident again in ’24. Sent out the historical chart last week and would advise using some of the averages in your analysis. For now its time to watch and see how the $3.00 level is handled.

Major Support:, $1.595, $1.52-$1.511, $1.481, $1.312
Minor Support : $2.844, $2.64, $2.448, $2.168, $2.12, $2.00, $1.967- $1.94
Major Resistance:
$2.94, $2.97, $3.00, $3.16

To read The Daily Call you must be a subscriber (Current members sign in here. ) Start your subscription today.

A Weekly Reversal of a Reversal

Weekly Continuation

Spoke a couple of weeks ago about Natural Gas’ tendency to define a bias shift as the price changes direction at a support or resistance area and reverse direction on a high volume week. Now we get a reversal higher last week, from and area that had supported the market previously (just below $2.50) and then found support. The lows of last week were just above the 40week SMA, before finding the bid and running upward to end the week over the downward sloping trend line (from the Nov ’23 high and Jan ’24 highs) that had held the market for the first 6 months of the year.

Volume during the last week was high, averaging 574,278 contracts per day. This was significantly higher than the previous week, but well short of the previous reversal week which averaged over 663,000 contracts per day. Similar to the previous reversal week- open interest declined slightly last week. The reversal last week left prices in the extreme over-bought zone for the Weekly RSI but not the Daily RSI, signalling a slight divergence.

To read The Daily Call you must be a subscriber (Current members sign in here. ) Start your subscription today.

Storage Release Creates Decline — Only to Reverse

Daily Continuous

Early morning strength gave way to selling on the storage data release, then the market spent the late morning rally back to develop a gain. Play the historical tendencies here.

Major Support:, $1.595, $1.52-$1.511, $1.481, $1.312
Minor Support : $2.448, $2.168, $2.12, $2.00, $1.967- $1.94
Major Resistance:
$2.844, $2.94

To read The Daily Call you must be a subscriber (Current members sign in here. ) Start your subscription today.

Gains Return

Daily Continuous

Spoke about the history of trade during June after the Memorial Day weakness. Below you see the trades from the lows (date and value) and the rally date setting the high (date and value).

The average percentage gains over the last 10 years is $.481 or 17.06%. This chart shows why the case has been made that prices rally in June setting the high for the month sometime towards the middle of the calendar month. The daily trade behavior seems to be similar to 2023 and would use this as the base case for the coming month.

To read The Daily Call you must be a subscriber (Current members sign in here. ) Start your subscription today.

July May Be Setting Up a Range

Daily Continuous

The June prompt started strong then developed a range at the end of the month. The July contract may be developing a range at the front of the month followed by volatility (either up or down) later in the month. Ran into a little data error in developing the history of rallies in June and will endeavor to provide it tomorrow.

Major Support:, $1.595, $1.52-$1.511, $1.481, $1.312
Minor Support : $2.168, $2.12, $2.00, $1.967- $1.94
Major Resistance:
$2.67, $2.844

To read The Daily Call you must be a subscriber (Current members sign in here. ) Start your subscription today.

Seasonal Trend Rhymes

Daily Continuous

Discussed yesterday the historical seasonal norms after the market trades to its Memorial Day weakness– which were evident with the brief rally yesterday. Going to put together a table of the June calendar rallies for tomorrow’s Daily. I did not site the weekly internal trends from last week in the Weekly report and I apologize. Volume fell last week 33% in average daily volume versus the previous week (last week average daily volume over 444,188 contracts versus the average daily the week before 663,043 contracts). Remember the previous week was the weekly reversal discuss then. Open interest declined last week by 30,418 positions (recognizing there was a contract expiration). As discussed previously– follow the volume trends in the near future.

To read The Daily Call you must be a subscriber (Current members sign in here. ) Start your subscription today.