To read The Daily Call you must be a subscriber (Current members sign in here. ) Start your subscription today.
Author: Willis Bennett
Minor Bounce Off of Support Test
To read The Daily Call you must be a subscriber (Current members sign in here. ) Start your subscription today.
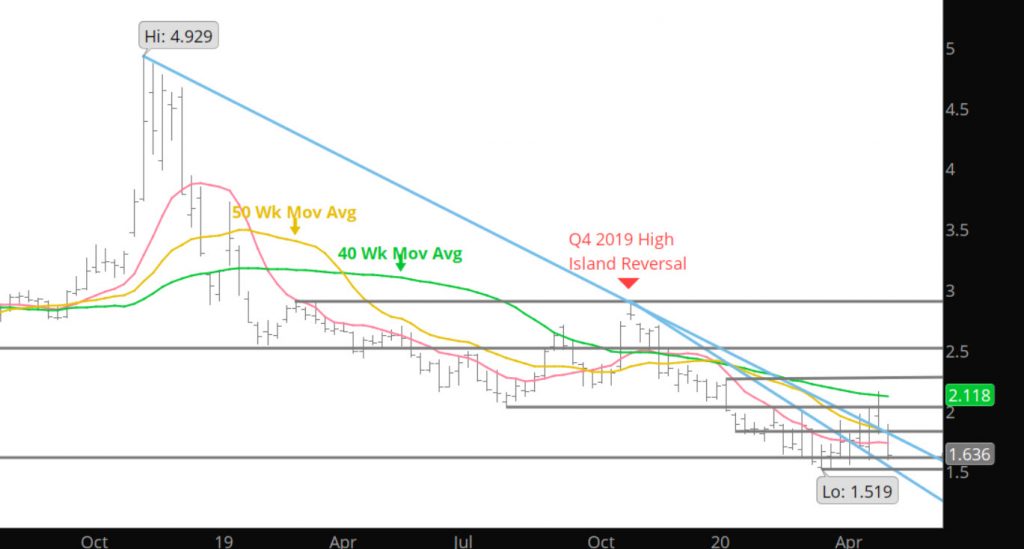
Trend Line Destruction Takes Prices to Test Major Support
To read The Daily Call you must be a subscriber (Current members sign in here. ) Start your subscription today.
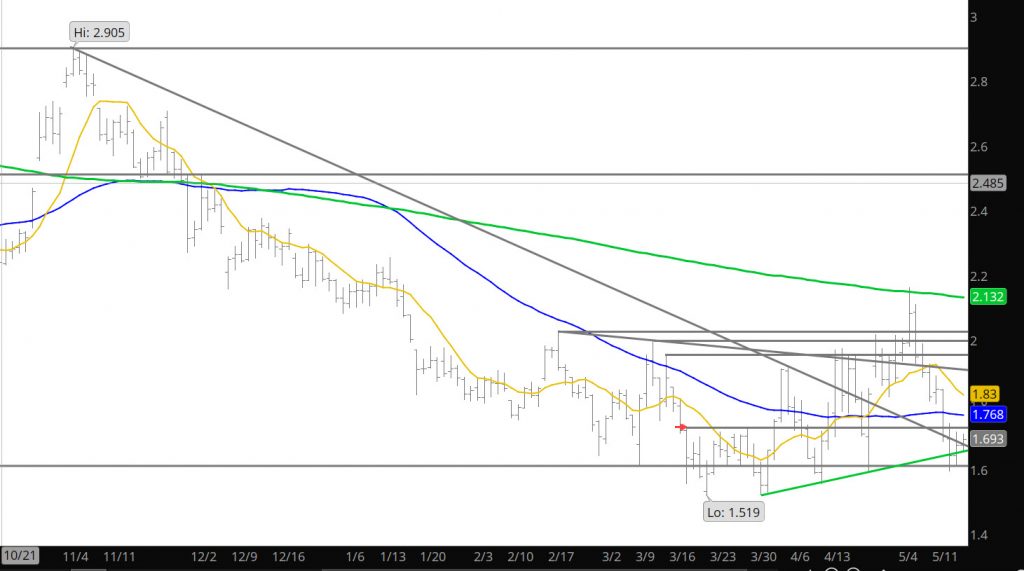
Prices Find Support
To read The Daily Call you must be a subscriber (Current members sign in here. ) Start your subscription today.
Trend Line Violation Opens Door For Declines
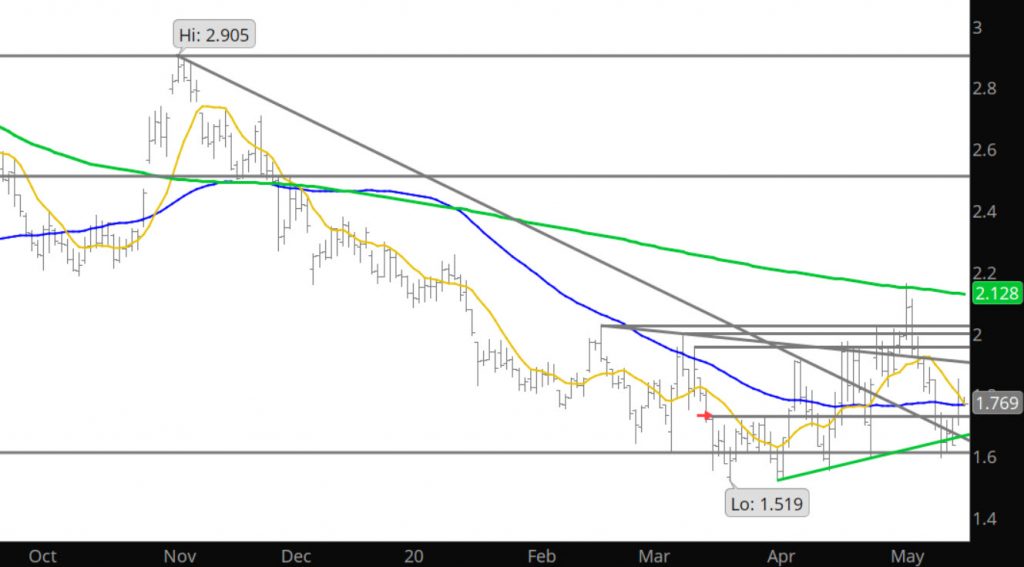
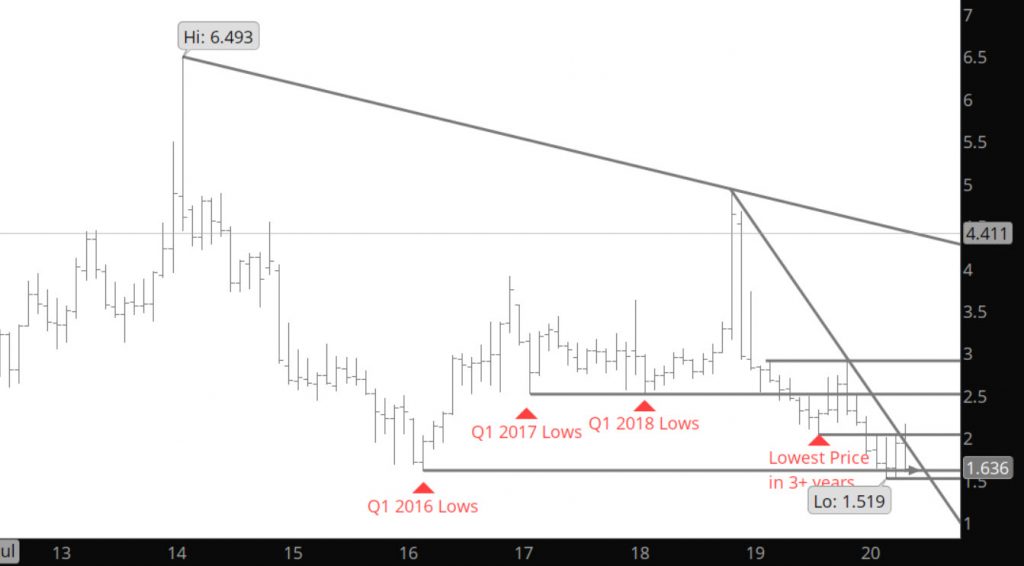
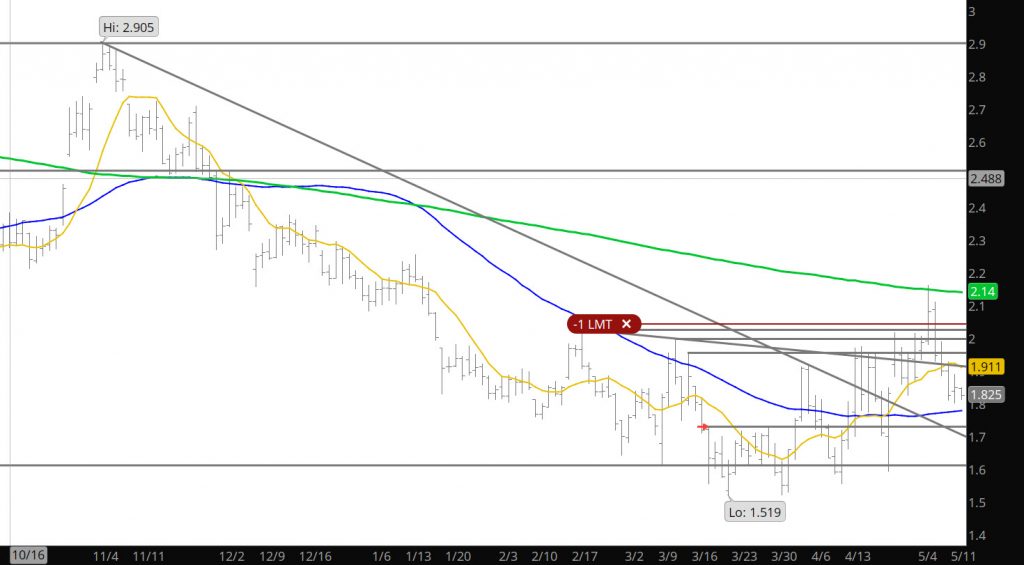
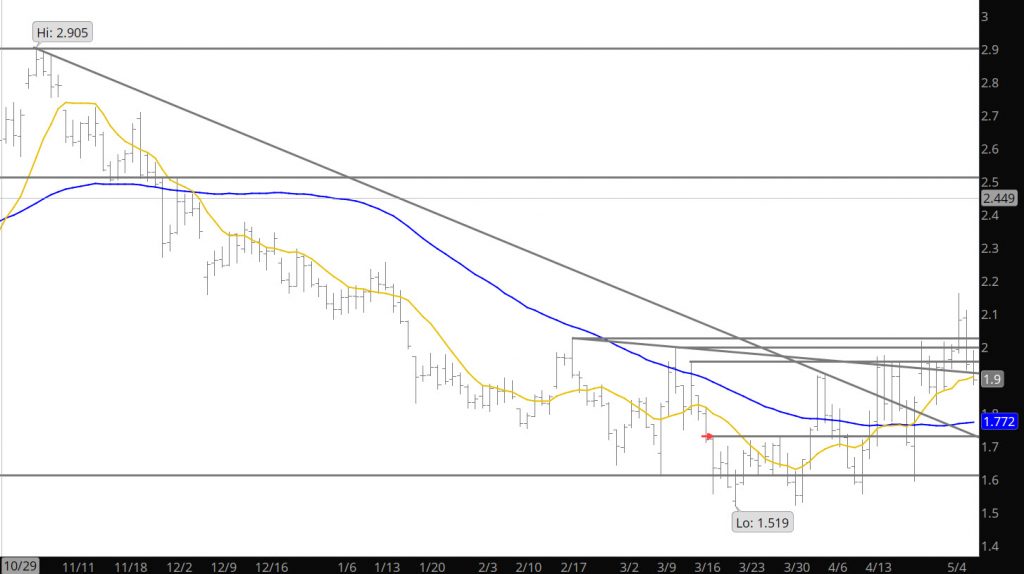
Once the trend line in the Weekly (see Web) and the spot June, the trap door was open, and some liquidation occurred. We may be similar in trade to 2016 which had an uncommonly early May Q2 high, but with the volume being rather anemic for this type of activity do not believe the high is in so close to the establishment of the Q1 low (just six weeks earlier). The trade does look like it wants to go down and test the expiration range low from the May expiration at $1.59. Would expect the area between the March low of the June contract ($1.649) and the previous mentioned low, to find some buying interest.
Major Support: $1.649-$1.611-$1.59, $1.555-$1.519
Minor Support:
Major Resistance: $1.82-$1.849, $1.873, $1.90
Minor Resistance: $2.029
Great Opportunity – No Follow Through

To read The Daily Call you must be a subscriber (Current members sign in here. ) Start your subscription today.
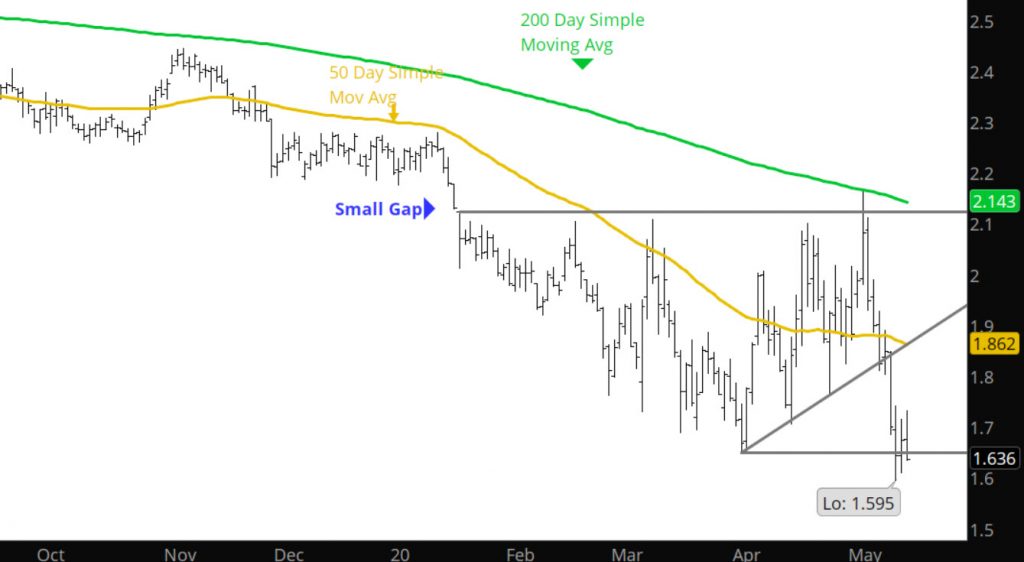
Extension Downward –Testing Trend Line Support

To read The Daily Call you must be a subscriber (Current members sign in here. ) Start your subscription today.
Strong Reversal Off of 200 Day
To read The Daily Call you must be a subscriber (Current members sign in here. ) Start your subscription today.
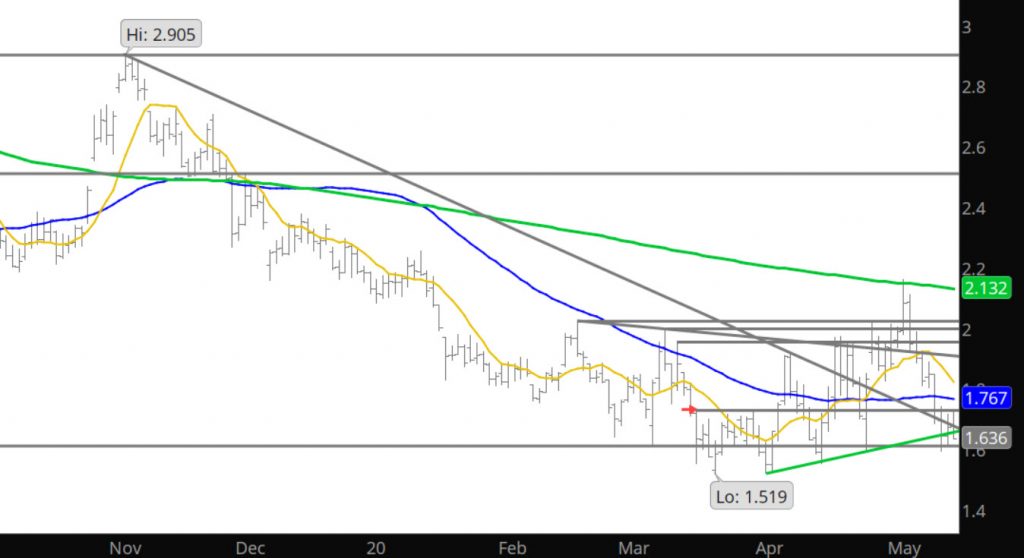
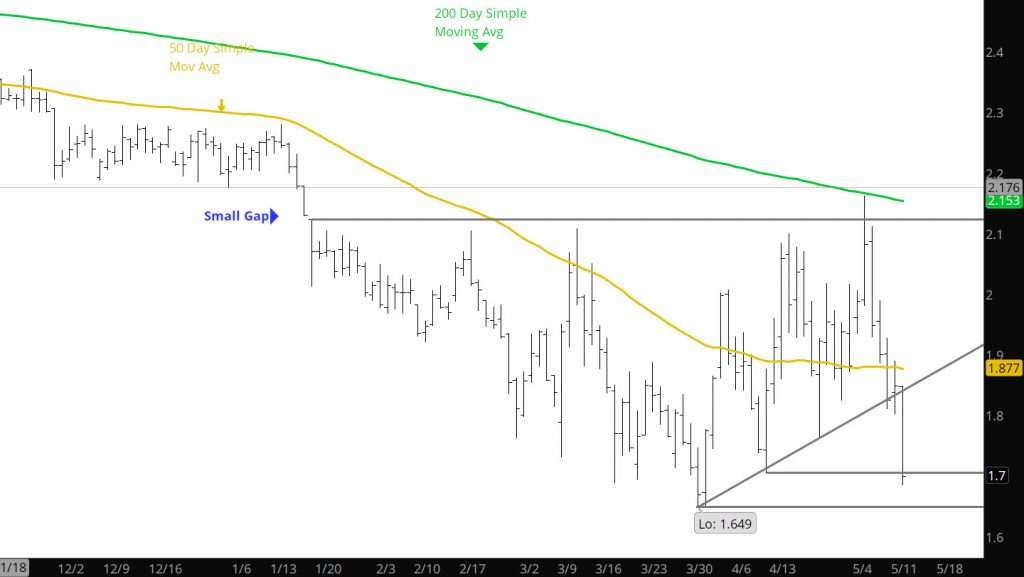
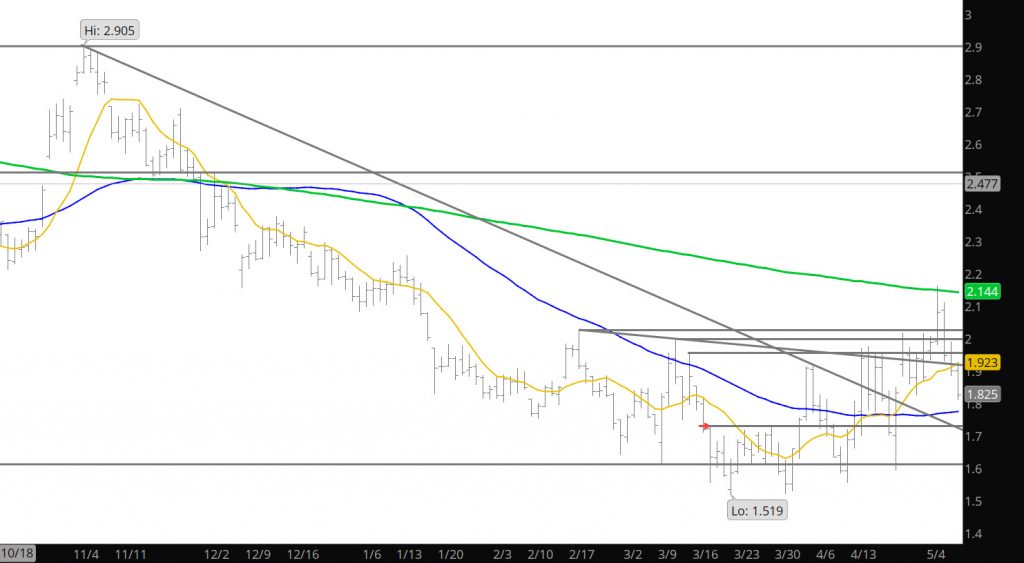
Additional Declines – No Dip Buyers Yet
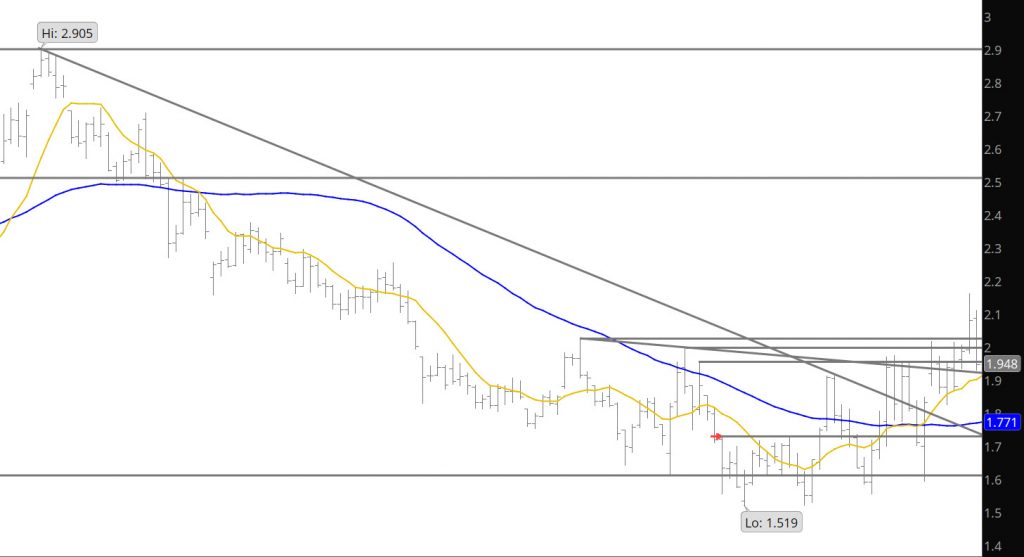
Not surprising to find additional declines post the storage report. The volume the last two day has been lighter on the declines than the short covering run early in the week, which should be expected. Perhaps the market is testing support and consolidating the gains made earlier in the week, but in reality the prompt is where it was post May expiration. Lots of volatility and no clear directional bias.
Major Support: $1.82, $1.611, $1.555-$1.519
Minor Support: $1.794, $1.78-$1.765
Major Resistance: $2.062,$2.08-$2.102–$2.108,$2.139-$2.16, $2.255
Minor Resistance:
Short Covering Rallies Promote Volatility
To read The Daily Call you must be a subscriber (Current members sign in here. ) Start your subscription today.