A Good Week to Go Fishing

Weekly Continuous

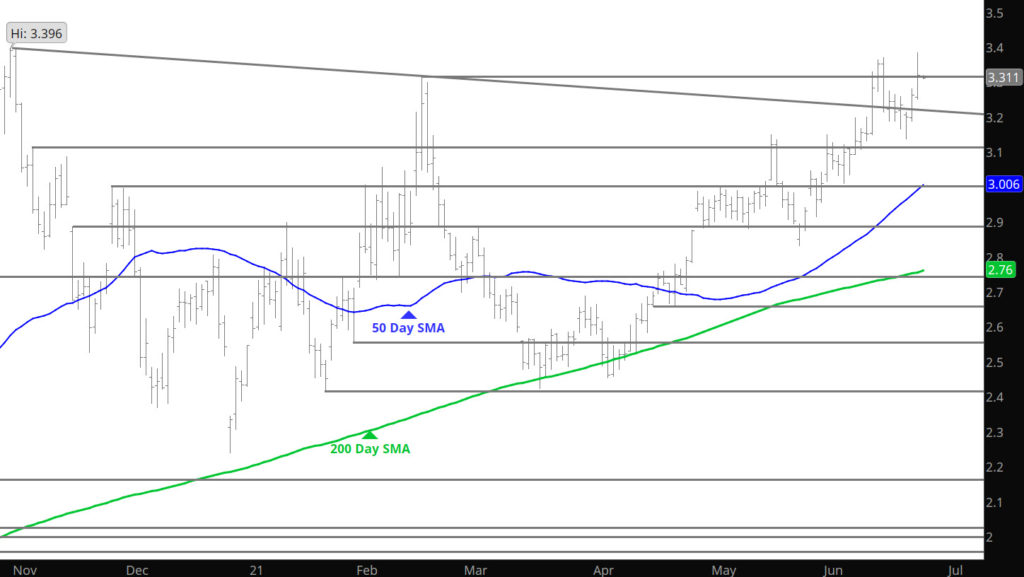
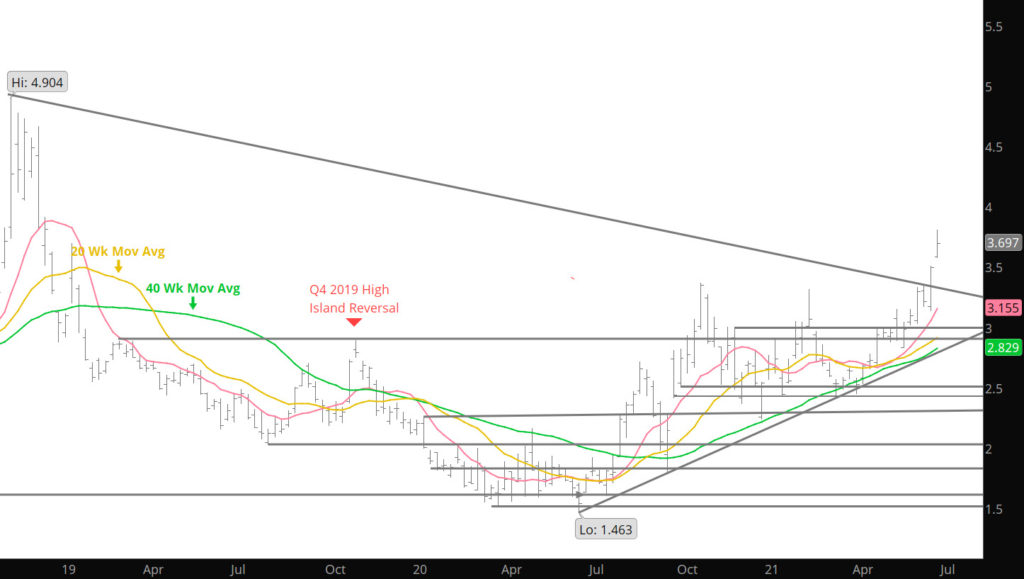
Gas traded an “inside” week — staying with in the previous week’s range and ended unchanged from last week’s close. I have tracked weekly ranges, opens and closes since the late ’90’s and I can’t think of the last time that the market closed almost exactly where it began (3.674 v 3.673). Friday’s close gave us three “tight” weekly closes (within $.026) which is also a pretty rare occurrence. This type of activity can clearly meets the standards of consolidation of the recent gains. Historically a market that is consolidating and struggling to establish momentum are usually resolved in the direction of the underlying trend with the release of technical “energy” that builds up during them triggers a significant range expansion.

That said, this market may be ready to attack higher levels but is missing some key indicators. Average daily volume has, on balance, declined since early June, while total open interest has increased significantly. Discussed here many times, bull markets have to keep feeding the beast. While it is good to see the gains in open interest, the change in “open interest” over time is a “lagging” indicator but historically substantial increases are inevitably followed by price declines while exceptionally low levels of open interest are characteristic of the construction of a low. Since the April low, the total number of contracts open in the market has increased from 1,164,269 to 1,466,459 (about 26% after already having increased from 1,117,622 with the January low). The last 155,057 of that increase has occurred since last month’s breakout through the October – November – February highs. That is a lot of new buying (which increases upside pressure on the bid) for a market that has gone absolutely nowhere for most of the last three weeks.

To read The Daily Call you must be a subscriber (Current members sign in here. ) Start your subscription today.

Well — That Worked Out Well

Daily Continuous

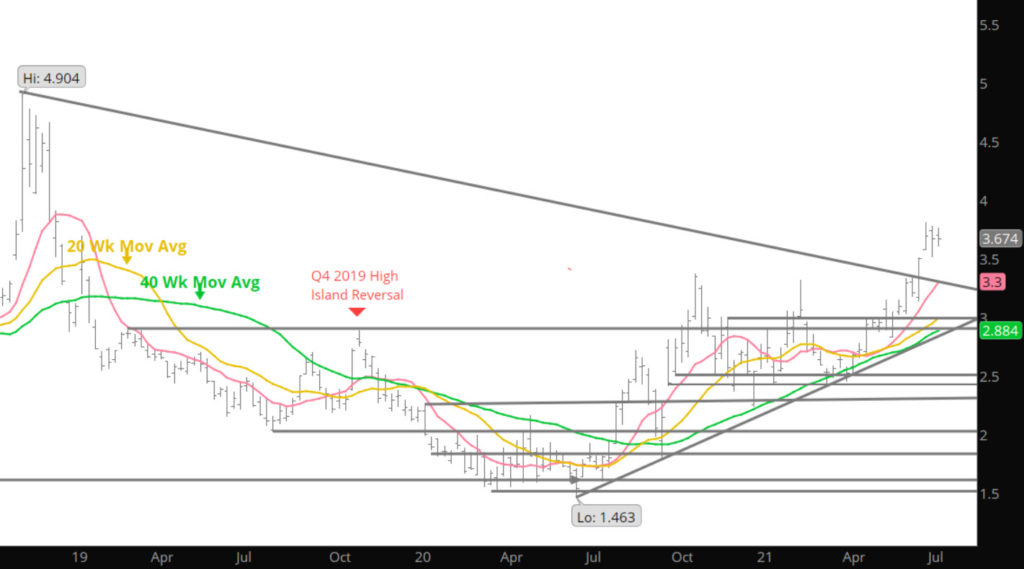
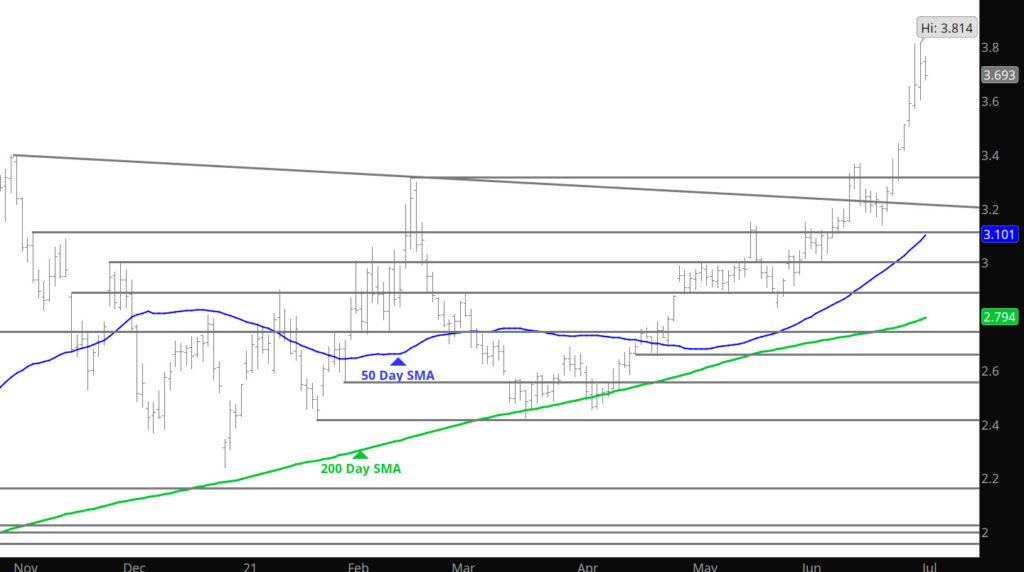
Very rarely when I take a week off — does the market trade an inside week (within the previous week’s high and low)– usually it blows up or out and I am left to explain what happened. Natural gas trade in a tight range (almost as boring as the fishing) only accomplishing further consolidation for the next move (be it up or down). Go into some of the thoughts of up or down in the Weekly area — for there is ample reasons for both directions. Prices are still in the extreme over bought area on the Weekly RSI but not on the Daily RSI so the consolidation comment is warranted. Price are headed into a seasonal weak period of the year (late July into the Labor Day weekend) so that should put some pressure on the market. The bulls can hang there bias on the market continuing to trade higher and open interest gaining (see Weekly), but volume is starting to weigh on movements. Still consider a brief pullback in order, but natural gas is in a longer term bullish trend (as discussed here since last fall).

Major Support: $3.58, $3.538-$3.511, $3.385, $3.368-$3.316, $3.198, $3.129
Minor Support:$3508-$3.485
Major Resistance:
$3.722, $3.769, $3.811-$3.821, $3.87, $4.66

To read The Daily Call you must be a subscriber (Current members sign in here. ) Start your subscription today.
Strength Begets Strength

I need to clear up some house keeping issues– I am fishing for Walleyes this week at a lake in Montana. There is no cell service nor internet service at this area so there will be no Daily nor Weekly until my return on July 13th or until further notice.

Daily Continuous

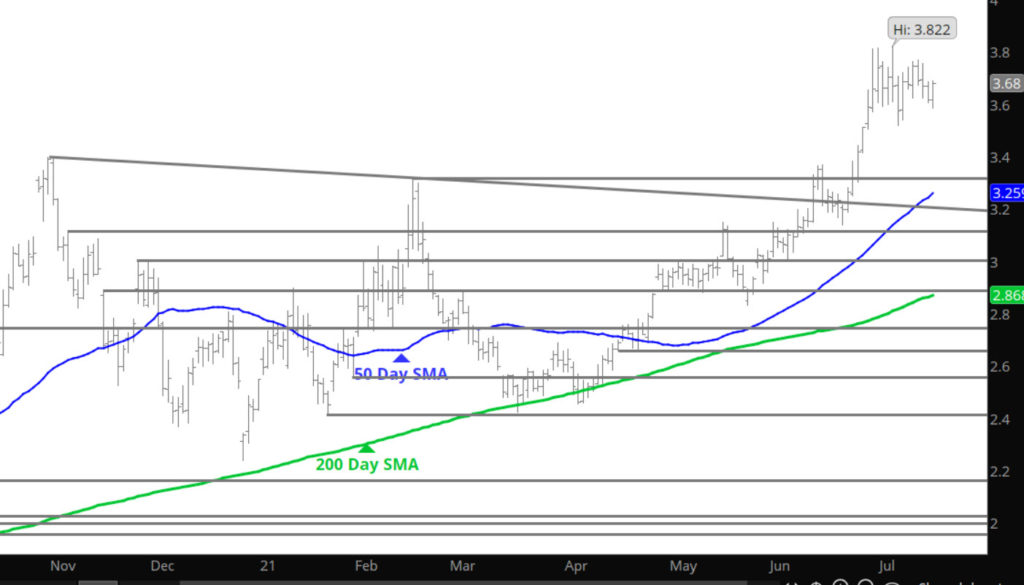
In the light trade on Sunday night and Monday, prices have rallied back up to the resistance area just short of $3.80. Rock and role kids but this market is over-extended and will be looking for air shortly. Would not be outright shorting (don’t trust the pockets of those I appose) but utilizing some put strategies may be valuable. When the market closes on a weekly basis at nearly 3 standard deviations over the 20 week SMA basis — go for it kids the risk of the rug leaving your foot far outweighs any additional gains, unless you are one of those special folk who has an algorithm that can pick the top– but if your one of those folk why do you subscribe.

To read The Daily Call you must be a subscriber (Current members sign in here. ) Start your subscription today.
The Bull Run Continues

I need to clear up some house keeping issues– I am fishing for Walleyes this week at a lake in Montana. There is no cell service nor internet service at this area so there will be no Daily nor Weekly until my return on July 13th.

Weekly Continuous

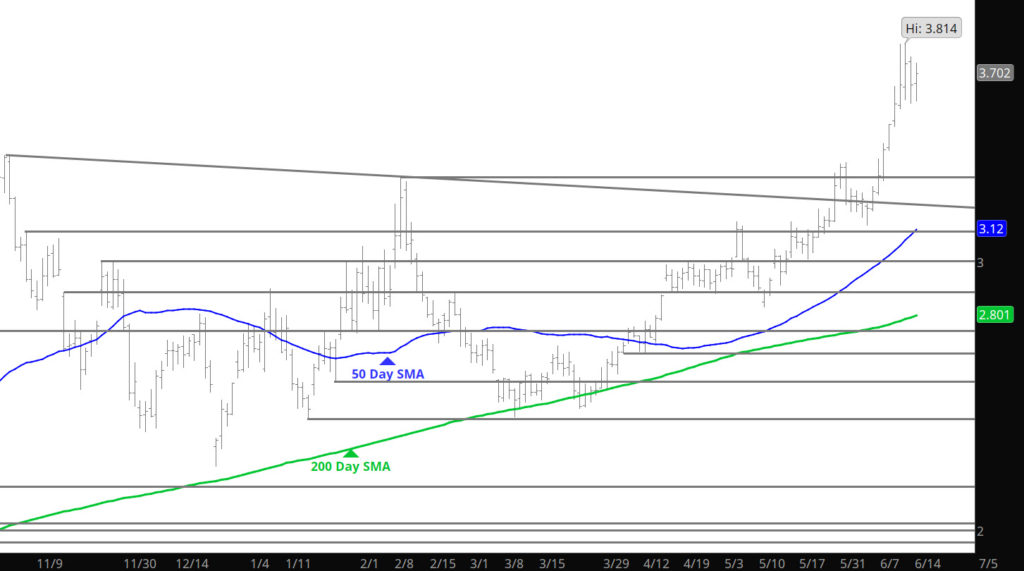
That said — this gas market is rocking as previous highs, that had kept a lid on prices rallies for two years, fell like lead weights on a lure. As noted here, I had been expecting some pull back and consolidation during this three week run, only to be shown the exit ramp. As mentioned several times this activity has brought the current overbought condition . Looking at two of my favorite condition studies; 1) standard deviation study (below) showing prompt gas closing between two and three standard deviations above the intermediate term 20 – week SMA for the third time in four weeks. This is a rate occurrence. There were two closes there in November of ’19 and there were four during the initial blast off from an extended trading range last summer. In both of those recent examples prompt gas traded back to and through the 20 – week less than a month later.

To read The Daily Call you must be a subscriber (Current members sign in here. ) Start your subscription today.
Another Signal of Consolidation

Daily Continuation

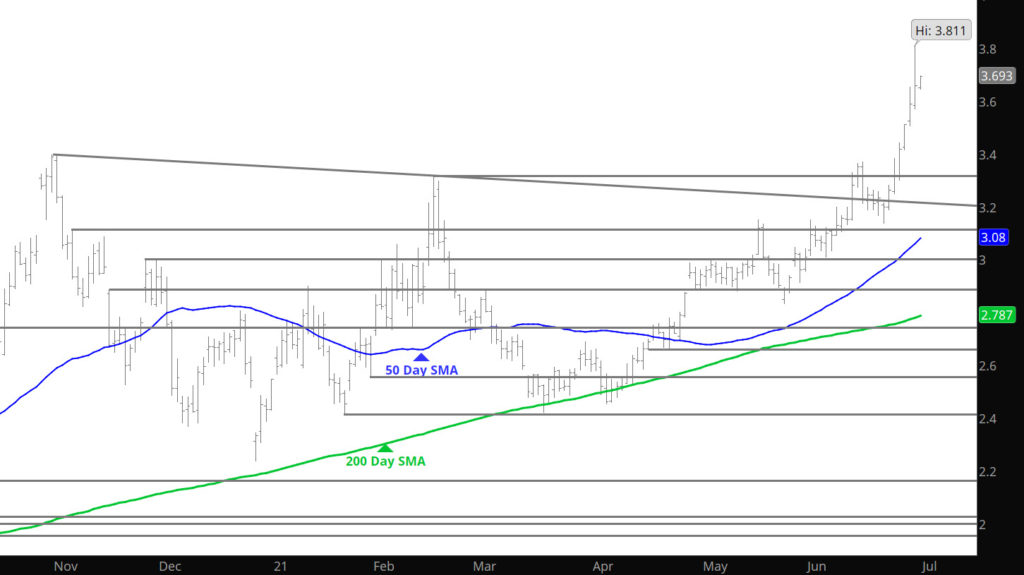
For the second day prices to break above $3.80 only to succumb to selling pressure before a pipeline issue took prices back up on an episodic event in the late afternoon in WV. At the time of this writing, prices have retraced much of the episodic event’s effect. Liked the start of a correction that occurred during the trade day and could well be the start of a consolidation process. My only concern was the episodic event causing the brief $.15 run in prices, suggesting that the market will potentially driven by headlines near term.

Major Support: $3.396, $3.368-$3.316, $3.198, $3.129, $3.02
Minor Support:$3.511-$3.538,
Major Resistance:
$3.722, $3.81

To read The Daily Call you must be a subscriber (Current members sign in here. ) Start your subscription today.
Start With a Bang – End With a Fizzle

Daily Continuous

Can’t even begin explain why, but prices looked to be rocking (similar to July’s expiration) only to run out of enthusiasm and buyers. This dearth of participants forced the market to decline below the close of Mon (August chart) before finding some footing and closing up on the day. As discussed here for eight months, natural gas has a distinctly bullish bias to its trade, but it does need to reform it’s behavior and develop support zones that can be used to propel prices to higher levels in the late summer (more likely fall). Trading well above 2 standard deviations over the 20 week SMA is not supportive behavior. BTW– in the web site a couple of weeks ago, I discussed the “potential” relationship of natural gas to the US$ (discussed by several “pundits”)– kiss that potential link down the road. The dollar has been rising seven of the last ten days and even more odd is the fact crude has been rising also– guess its a new world order.

Major Support: $3.396, $3.368-$3.316, $3.198, $3.129, $3.02
Minor Support:$3.511-$3.538,
Major Resistance:
$3.722, $3.81

To read The Daily Call you must be a subscriber (Current members sign in here. ) Start your subscription today.
July Expires Strong

Daily Continuous

If you needed additional evidence of the strength in Nat Gas prices look to yesterday’s expiration and following its last three predecessors by rallying into expiration. Not much you an say about a bull run outside of what I highlighted in the Weekly section yesterday. The consolidation should commence but not convinced the rally in mid-term is over.

Major Support: $3.396, $3.368-$3.316, $3.198, $3.129, $3.02
Minor Support:
$3.511-$3.538,
Major Resistance: $3.722

To read The Daily Call you must be a subscriber (Current members sign in here. ) Start your subscription today.
On Fire

Daily Continuous

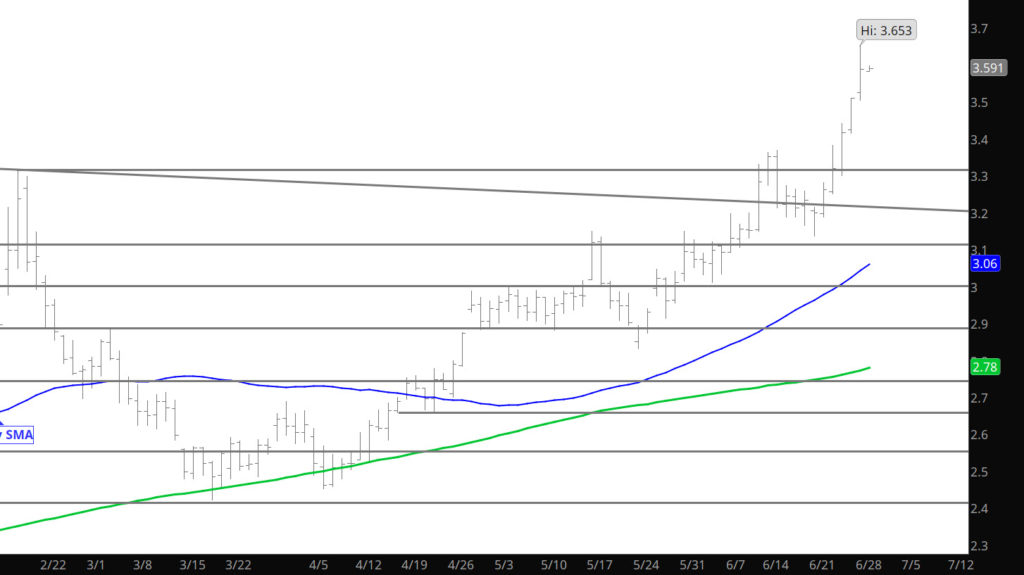
Prices broke out to an over two year high (since Dec’ 18) last week and ran through what I would of thought was serious resistance. Poo Poo, that concept while prices close the week on the highs. The only elements missing were the weekly volume flat’ish to the previous week and open interest falling (early estimates). Other than that it is all systems go — right? Be sure to read my Weekly section as there is some color brought by this rally from a long term perspective. I do not subscribe to a continuation of this meteoric rise continuing until it consolidates the gains. Price gains may continue into the first week of July but there will be a reckoning from a technical perspective– just don’t know from where.

Major Support: $3.396, $3.368-$3.316, $3.198, $3.129, $3.02
Minor Support:
Major Resistance: $3.511-$3.538
, $3.722

To read The Daily Call you must be a subscriber (Current members sign in here. ) Start your subscription today.
Bully, Bully, Bully But

Weekly Continuous

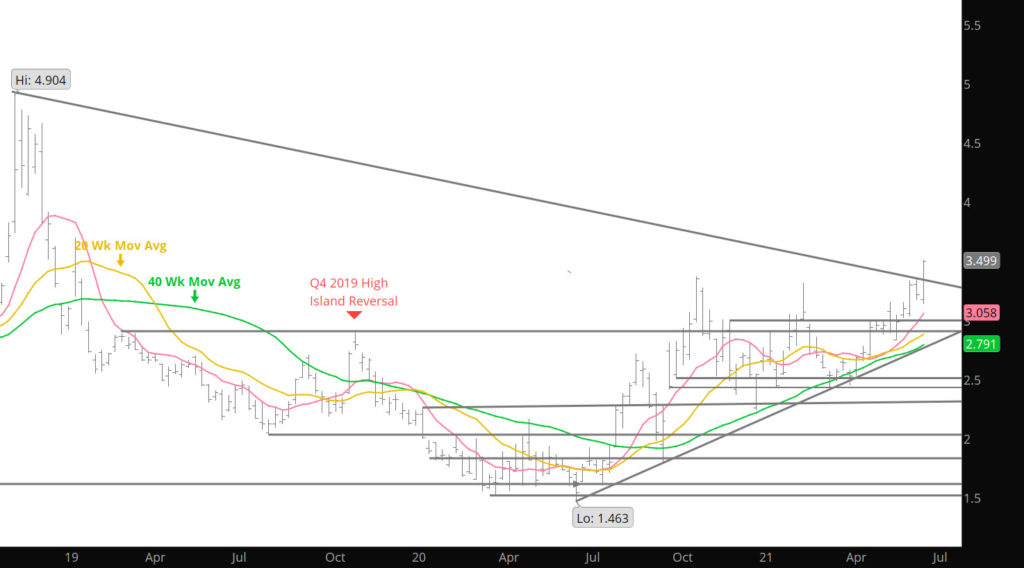
In my world of technical analysis price is always the most important factor in trading and nothing is as bullish as a new high close, in this instance the highest weekly close since the week ending 12/21/18. In addition to that high the bullish implications of the breakout is that the continuous one – year STRIP of prices posted its highest weekly close in more than four years going all the way back to the week ending 05/12/17. Discussed here last fall, when solid indications started, the natural gas market was and continues to change its stripes.

That said, the market is a tad spicy in my view as the rally to higher highs, not scene for over two years, has left prices challenging over bought levels in the Daily and Weekly RSI evaluations. The weekly RSI returned to the edge of its historical extreme zone, ending the week slightly higher than week before last (79.83 v 79.21). The last time the sensitive “leading” indicator was higher was the week of the October – Q4 high and only remained at that elevated level for one week. Another indicator is the Bollinger study below:

To read The Daily Call you must be a subscriber (Current members sign in here. ) Start your subscription today.
Break Out Upon Us

Daily Continuous

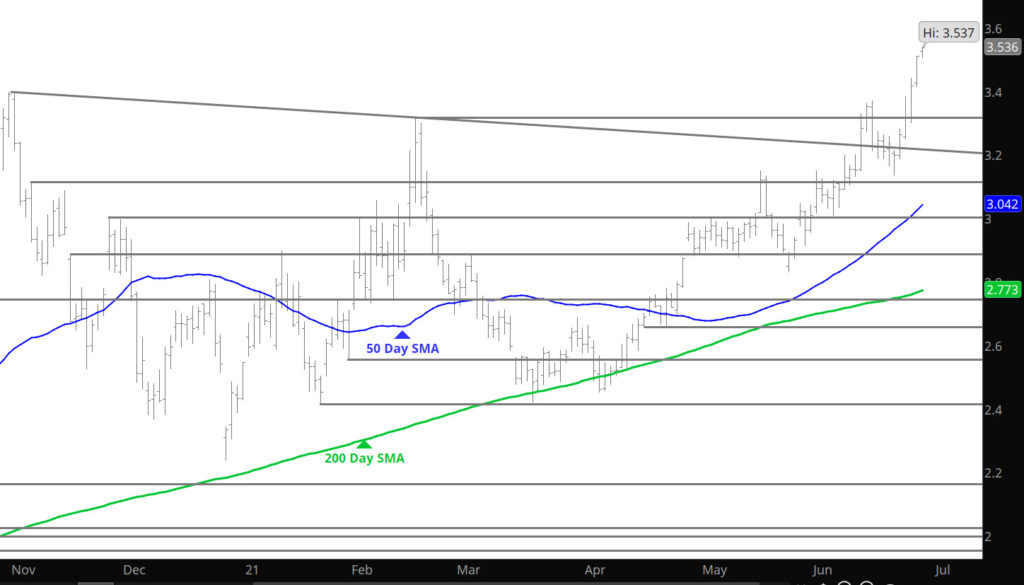
I apologize for providing a Daily Chart from Wednesday — I am traveling back to CO and my screen editor does not like the fact I only have one screen. The market broke above the highs from Oct and Nov and I was expecting more of short covering rally– but no such luck. Now the key for the market is to hold the old resistance as support and to build on the break out through the expiration. Some elements would suggest that the real fun will start on options expiration between $3.35-$3.50.

Major Support: $3.396, $3.198, $3.129, $3.00 $2.914-$2.886, $2.78,
Minor Support:
Major Resistance: $3.396
, $3.482, $3.526

To read The Daily Call you must be a subscriber (Current members sign in here. ) Start your subscription today.