Declines Expected With Seasonal Weakness

Weekly Continuation

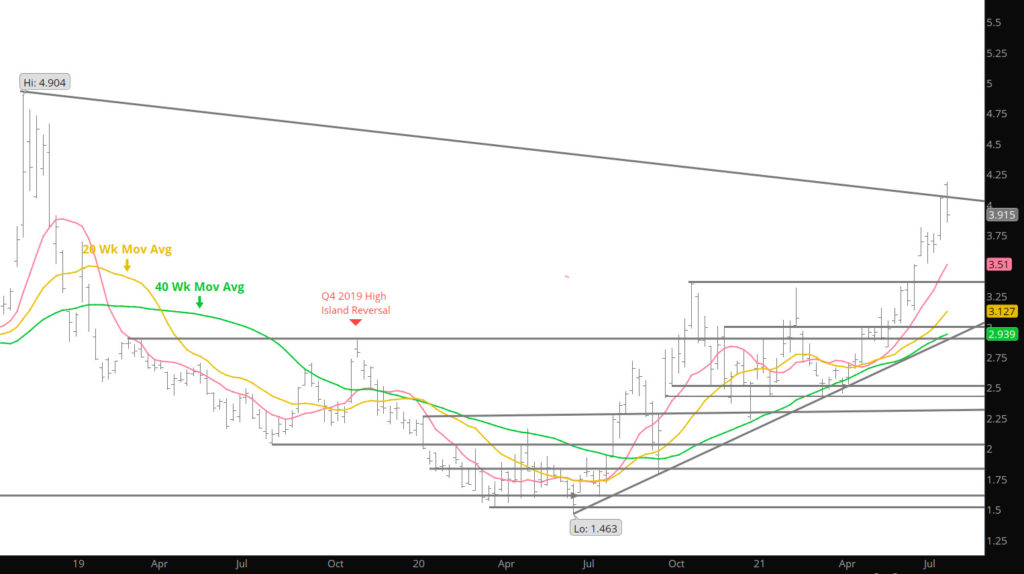
If you are familiar with my diatribes over the years, you will recognize one of my strongest historical references is the consistent annual weakness that occurs in Q3on the corrections after the Q2 upward trend in prices. This year will not be different except that the Q2 rally did not end in June (Q2) but spilled over to July (Q3). While it would be more accurate if the market were to conform to the agenda , as traders we need to be flexible (for instance the Q3 low occurred at the end of June as the July contract expired) with our “rules”. History shows us that prices have a tendency to rally in late spring into early summer and then take a hiatus in late summer and early fall. Why this occurs is far beyond my pay grade and don’t really care– focusing on the trade rather than the “why”.

Last week brought a glimpse of the seasonal weakness that should occur in the coming weeks, trading a reversal week after setting a high early in the week before reversing lower during expiration and the end of the week. August gas traded as high as 4.187 before settling at 4.044. That was the highest monthly settlement since December ’18 settled at 4.715. On a weekly closing basis, prompt gas traded a technically price negative reversal lower but without the volume spike that customarily accompanies intermediate term highs. That should provide eager bears with some food for thought. The market has not confirmed the “all clear” against additional runs.

To read The Daily Call you must be a subscriber (Current members sign in here. ) Start your subscription today.

Range Type Expiration

Daily Continuous

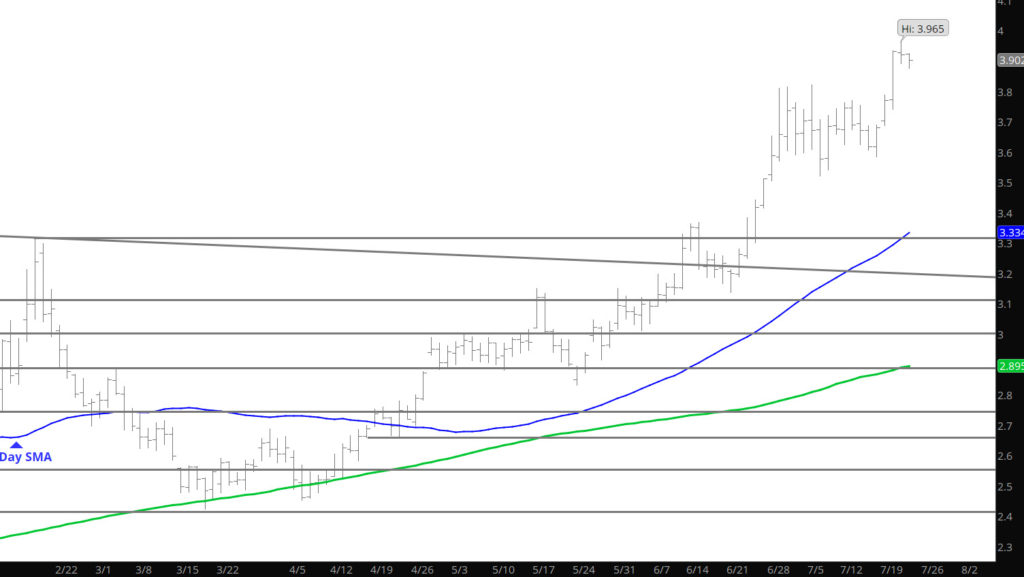
The expiration of Aug tracked a range either side of $4.00 continuing the trend of being well bid on expiration day. Now we look to at the Sept for leadership which will likely trade toward the lower end of the Aug range should the consolidation (starting earlier this week) continues its trend. While Aug tested the minor support area yesterday at $3.87, September may immediately want to test the same support. Should the bulls spark the Sept contract look for the Aug highs ($4.064) as the initial resistance.

Major Support: $3.722, $3.58, $3.538-$3.511, $3.385, $3.368-$3.316, $3.198,
Minor Support: $3.87, $3.821, $3.508-$3.485
Major Resistance:
$4.054-$4.094, $4.187, $4.238

To read The Daily Call you must be a subscriber (Current members sign in here. ) Start your subscription today.
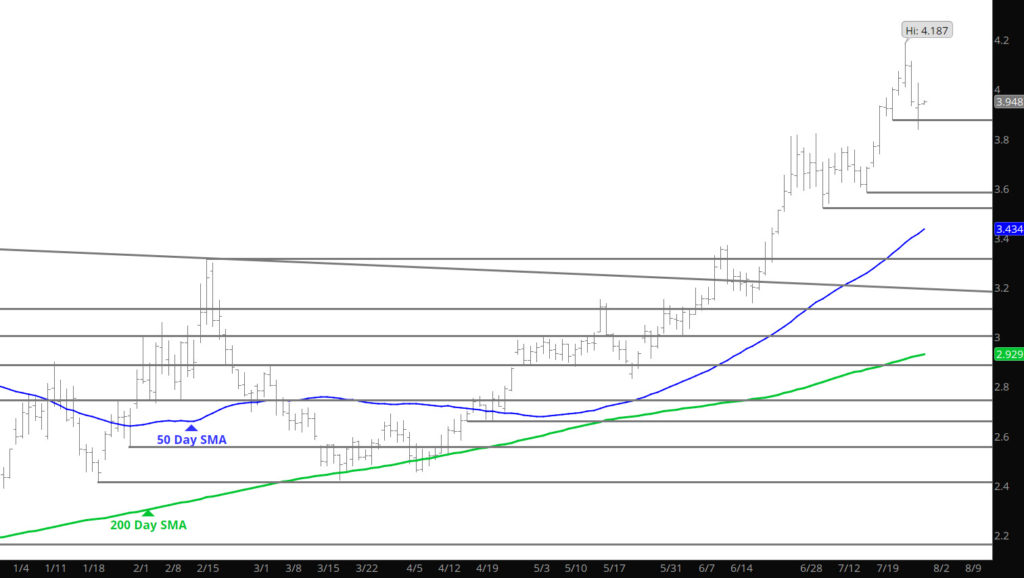
Shocking — Down Day

Daily Continuous

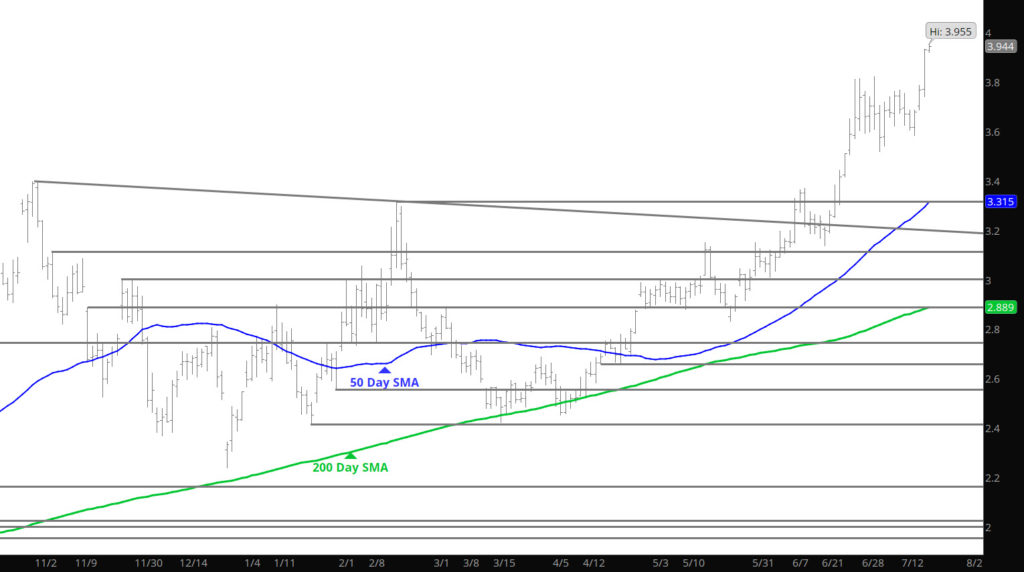
After six days of gains for natural gas, prices went down yesterday, hopefully starting the consolidation period I have been looking for the last ten days. Today is expiration so the focus shifts to the Sept chart below:

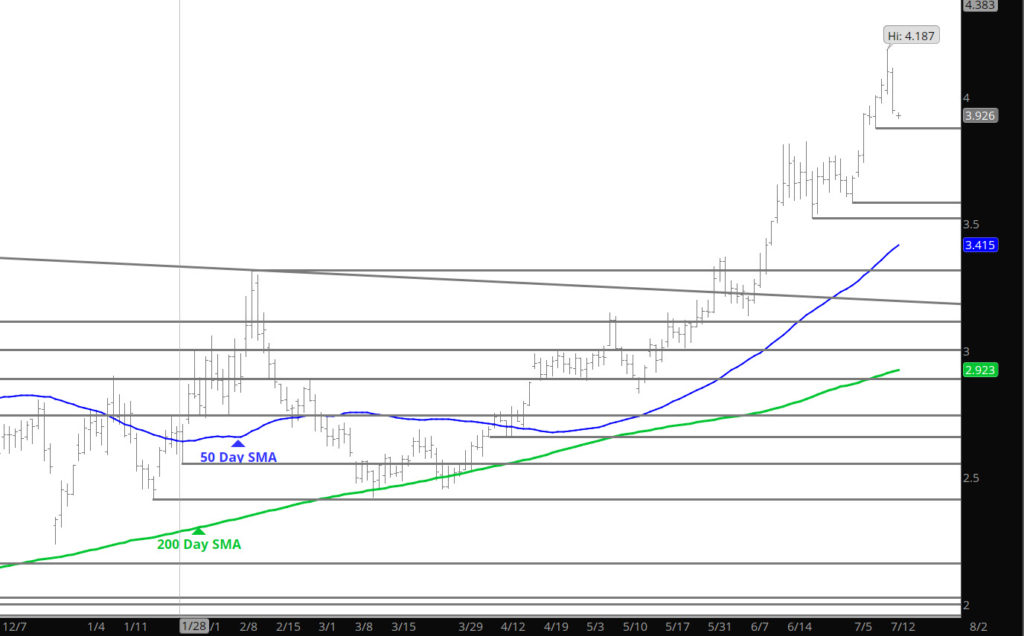
Spot September Contract

Not a significant area of support but the area around $3.87 could be significant short term for the September contract either today or when it takes over as prompt. After the recent strength in the Aug contract and the trend of the last few expiration’s (discussed previously) — what happens today in the expiration is anyone’s guess.

To read The Daily Call you must be a subscriber (Current members sign in here. ) Start your subscription today.
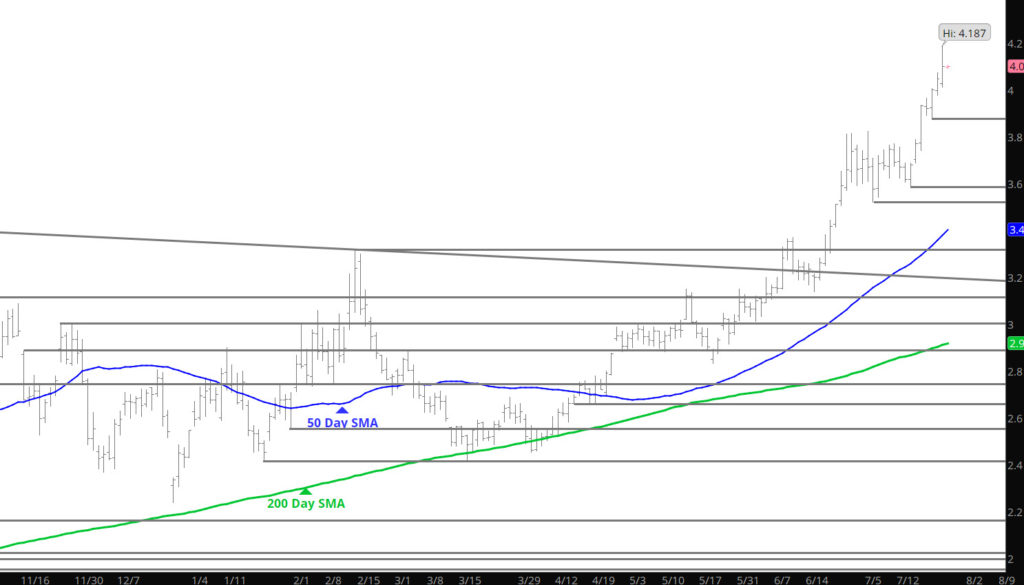
Beat Goes On

Daily Continuous

I have no clue what piece of information hit the market at 8 am (EDT) but prices started to garner strength peaking about an hour later at $4.187– sending all the momentum analysis to new levels of strength (though still overbought). Mentioned yesterday, that the recent trend of expiration’s has been strength during the process and this month looks to be continuing that trend.

Major Support: $3.722, $3.58, $3.538-$3.511, $3.385, $3.368-$3.316, $3.198,
Minor Support: $3.821, $3.508-$3.485
Major Resistance:
$4.054-$4.094, $4.187, $4.238

To read The Daily Call you must be a subscriber (Current members sign in here. ) Start your subscription today.
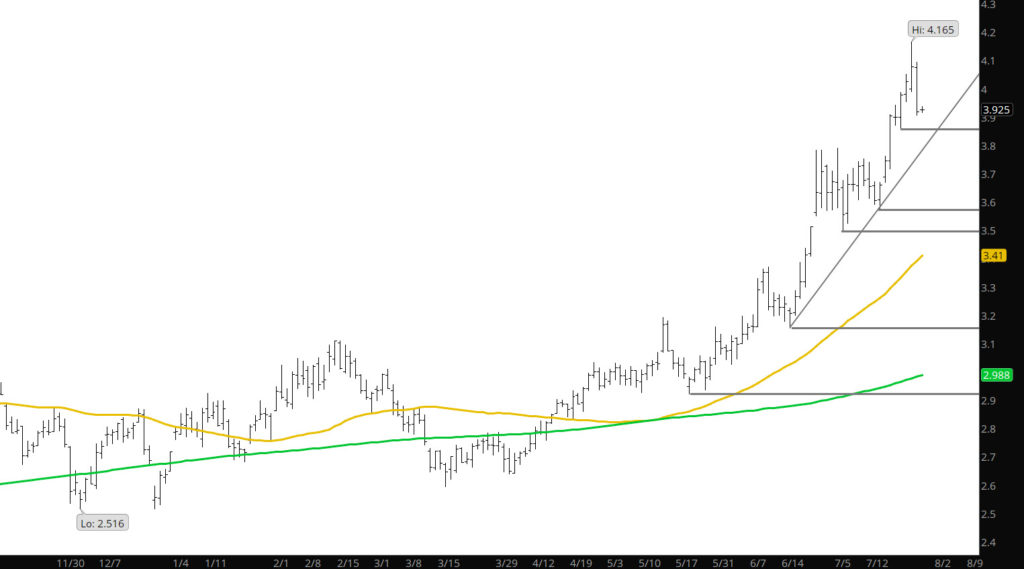
Silliness May Continue But Reckoning Coming

Daily Continuous

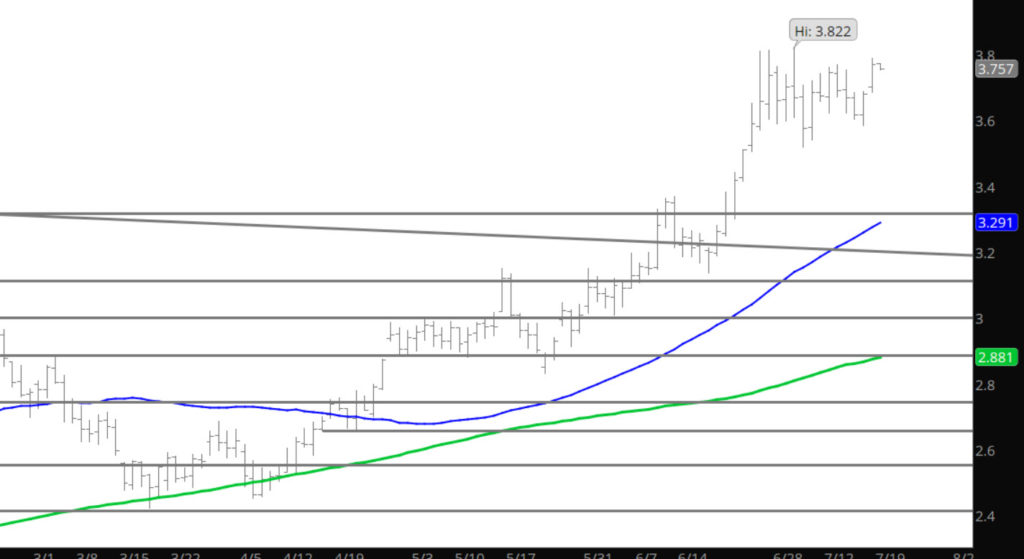
Went into some of my reasons to doubt the sincerity of this run at this point in the Weekly section and I advise a brief look. Price may continue there ascent, as perhaps the uptrend will continue and add some more cushion before going off the board. The last four expiration months have. I will be on the sidelines in August and continue the downside trades (discussed last week) into the September contract.

Major Support: $3.722, $3.58, $3.538-$3.511, $3.385, $3.368-$3.316, $3.198,
Minor Support: $3.821, $3.508-$3.485
Major Resistance:
$4.054-$4.094

To read The Daily Call you must be a subscriber (Current members sign in here. ) Start your subscription today.
Something Is Amiss

Weekly Continuation

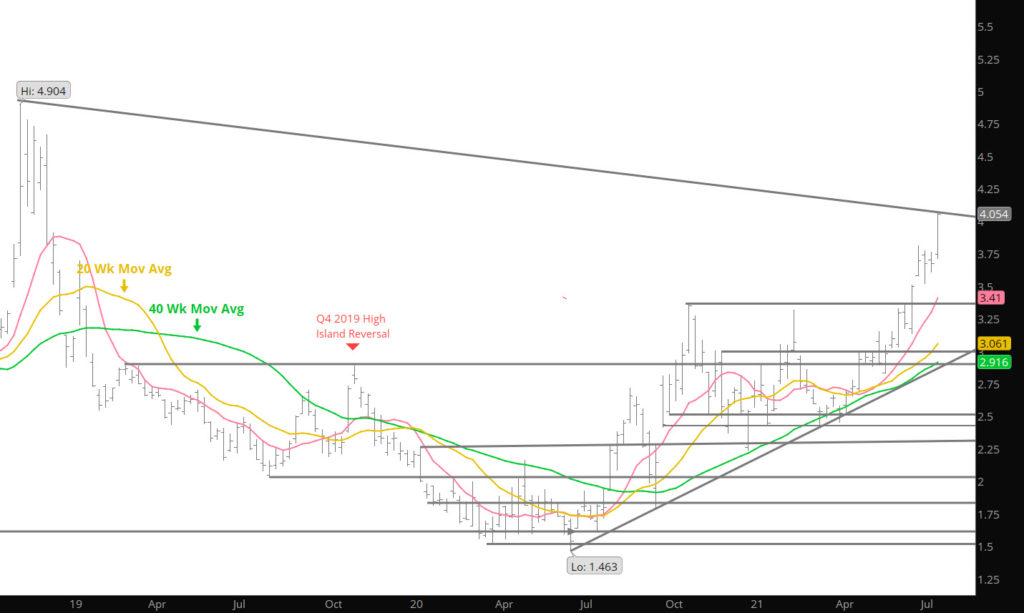
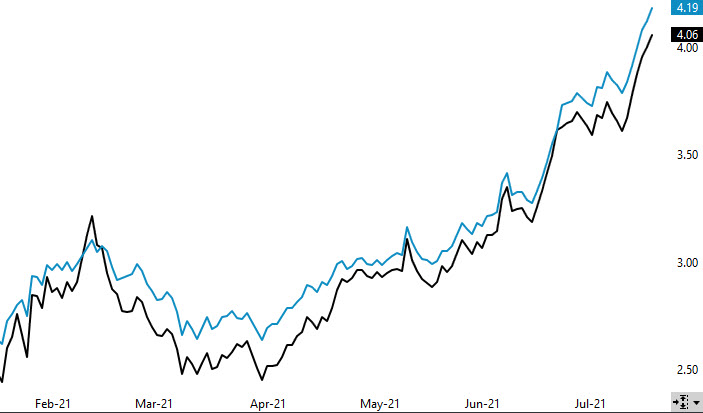
Lots of charts this week with just some brief commentary about the market that is not trading “properly”. There is a slight odor beginning to emanate from price action though not sure what it is. Looking at the weekly chart above– it looks like a solid bull run with little or no correction for the last 8 weeks– that is not normal behavior (especially for natural gas). Some fundamental based traders tell me it is concerns about supplies going into the upcoming winter — at face value the market is not confirms such concerns. Look at the chart below:

Jan 22 Daily Continuous vs Aug 21 Daily Continuous

The blue line reflects the upcoming Jan ’22 contract and has narrowed on the recent run to only $.13 over August. That does not reflect substantial concerns about the upcoming winter supplies. Much less– it takes the value of storage off the table as it doesn’t cover the carry costs much less the direct cost of storage. Winter should be rising at the pace of cash (or Aug) if winter was an issue. Perhaps it too will run later in the fall. When Aug corrected (very briefly) early in July the spread was out to $.20 which does reflect some concerns (prompt declines – winter declines less).

To read The Daily Call you must be a subscriber (Current members sign in here. ) Start your subscription today.
Got It

Daily Continuous

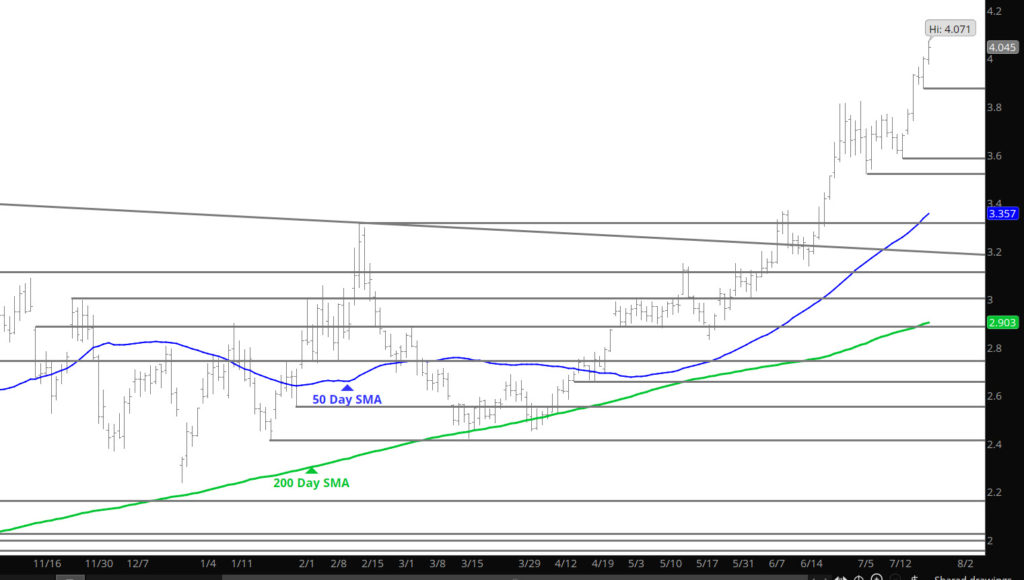
Well- prices finally got what they seemed to be thinking and that was trading above the $4.00 point. Now what? The market is over-bought in the extreme zone on both the daily and weekly chart; the market seems to be chasing 3 standard deviations above the 20 week SMA– let alone well above 2 standard deviations; and volume is stagnate. I will not be buying into this leg of the run– as stated numerous times in the last week– it needs to chill. Starting to look at some puts as it continues to get bullish blind.

Major Support: $3.722, $3.58, $3.538-$3.511, $3.385, $3.368-$3.316, $3.198, $3.129
Minor Support: $3.821, $3.508-$3.485
Major Resistance:
$4.054-$4.094

To read The Daily Call you must be a subscriber (Current members sign in here. ) Start your subscription today.
Not Yet

Daily Continuous

Prices certainly gave the effort to hit $4.00, but once again, prices melted away toward the end of the day. You all know that I would like to see a retracement before prices can gain the momentum to break above that key level. This may extend lower as prices are declining late at night.

Major Support: $3.722, $3.58, $3.538-$3.511, $3.385, $3.368-$3.316, $3.198, $3.129
Minor Support: $3.821, $3.508-$3.485
Major Resistance:
$3.87-$3.905, $3.955, $4.054-$4.094

To read The Daily Call you must be a subscriber (Current members sign in here. ) Start your subscription today.
Hmm — Perhaps a Blow Off

Daily Continuation

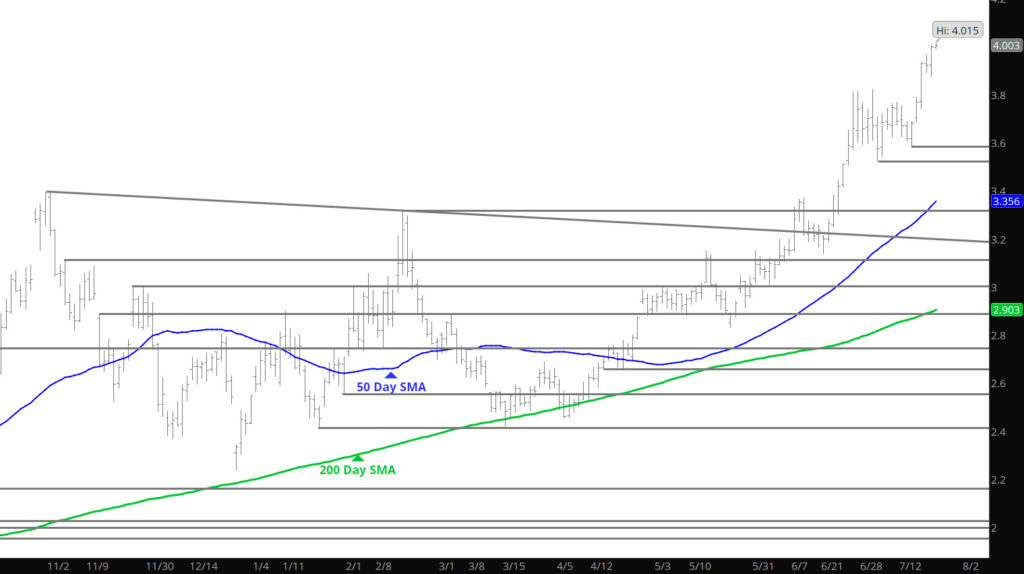
Not sure yet — but his is starting to take on the characteristic “blow off top”. Why do I mention — the market continues to run at 2 standard deviations above the 20 week SMA– the market continues to trade above the extreme zone on the Weekly RSI. That said, as I mentioned the other day, the Daily RSI still has not entered the extreme over bought but is starting to tickle it. Folks just keep buying it (for what ever reason) which leads me to start questioning the type of rally this is. Volume remains neutral and open interest does not seem to be waning. It seems that the target of $4.00 is a desire for a few– I still expect a retracement to assist in forming a base for the annual Q4 run. If it is a blow-off set stops tight otherwise join me in waiting for a retracement to reset length.

Major Support: $3.722, $3.58, $3.538-$3.511, $3.385, $3.368-$3.316, $3.198, $3.129
Minor Support: $3.821, $3.508-$3.485
Major Resistance:
$3.87-$3.905, $3.955, $4.054-$4.094

To read The Daily Call you must be a subscriber (Current members sign in here. ) Start your subscription today.
What Is With Natural Gas

Daily Continuous

On a day where the energy sector was taken to the shed — Natural gas started with gains an kept them through the day— regardless of the dollar. It is starting to seem like some investors are wanting to see the response over $3.80 similar to the trade over $3.40 a few weeks ago. My comments are the same now as then when you are near the top of a range you sell for profits and if shorting outright– keep stops tight.

Major Support: $3.58, $3.538-$3.511, $3.385, $3.368-$3.316, $3.198, $3.129
Minor Support:$3.508-$3.485
Major Resistance:
$3.722, $3.769, $3.811-$3.821, $3.87, $4.66

To read The Daily Call you must be a subscriber (Current members sign in here. ) Start your subscription today.