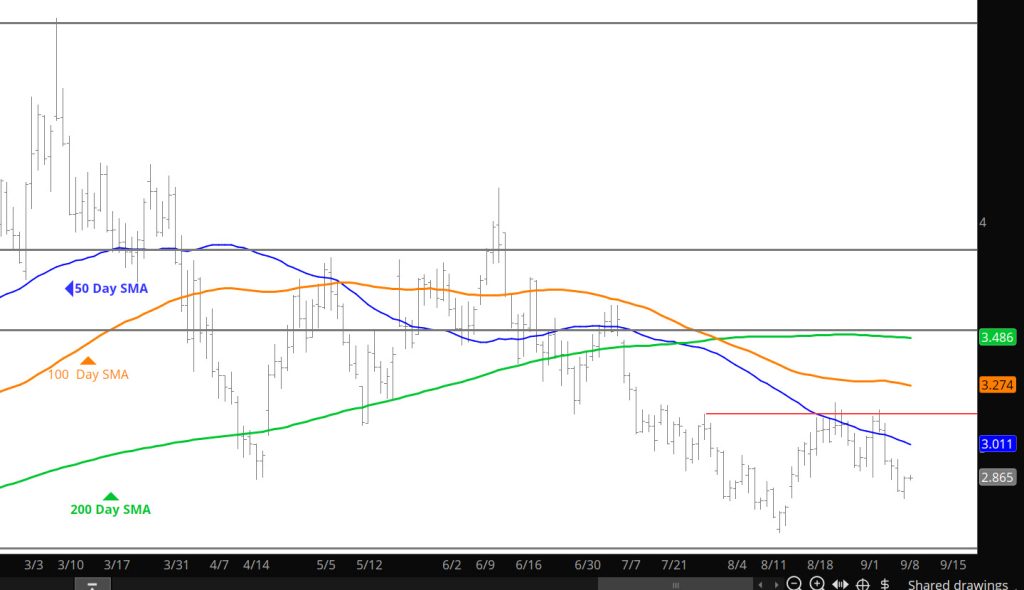
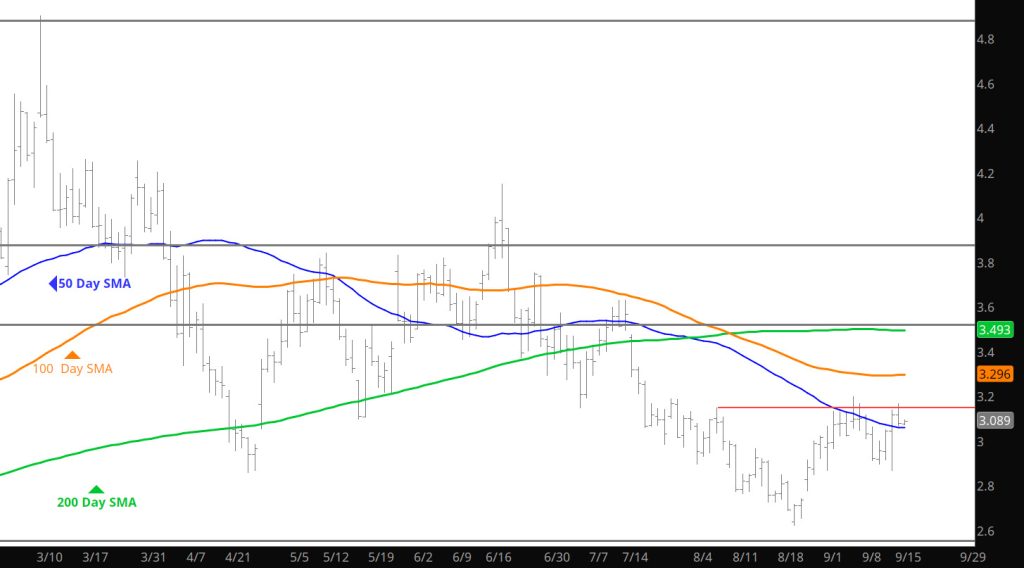
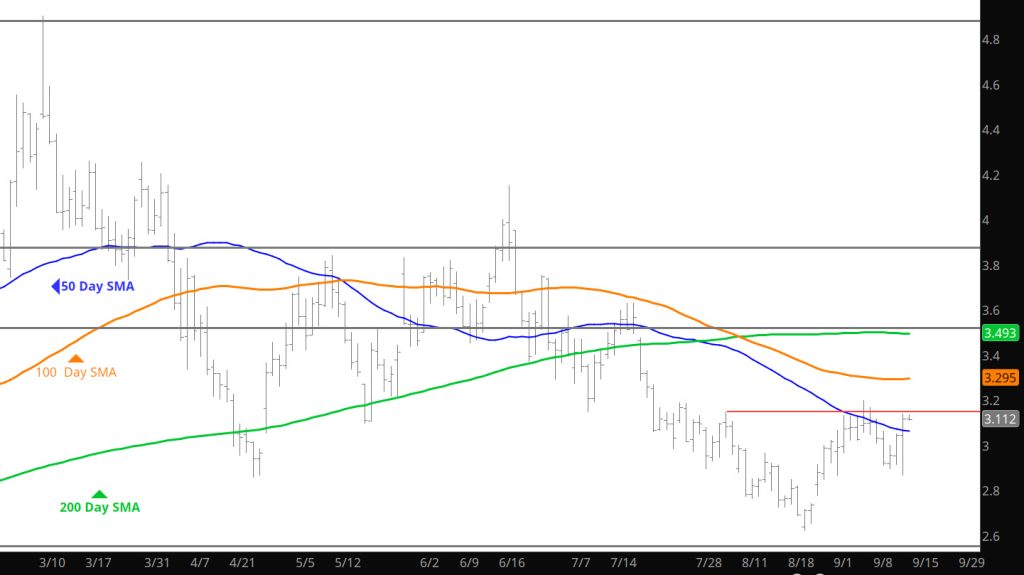
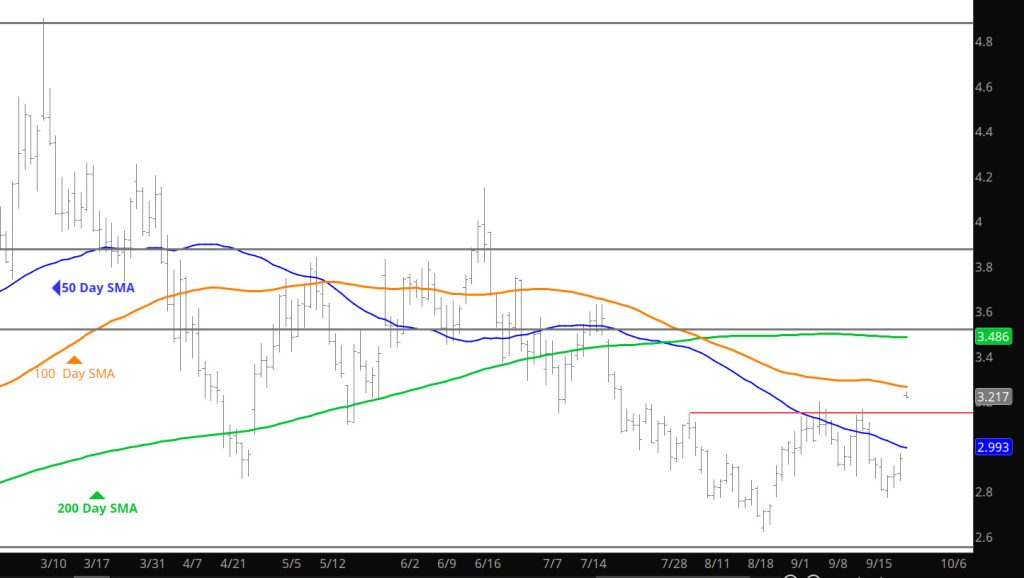
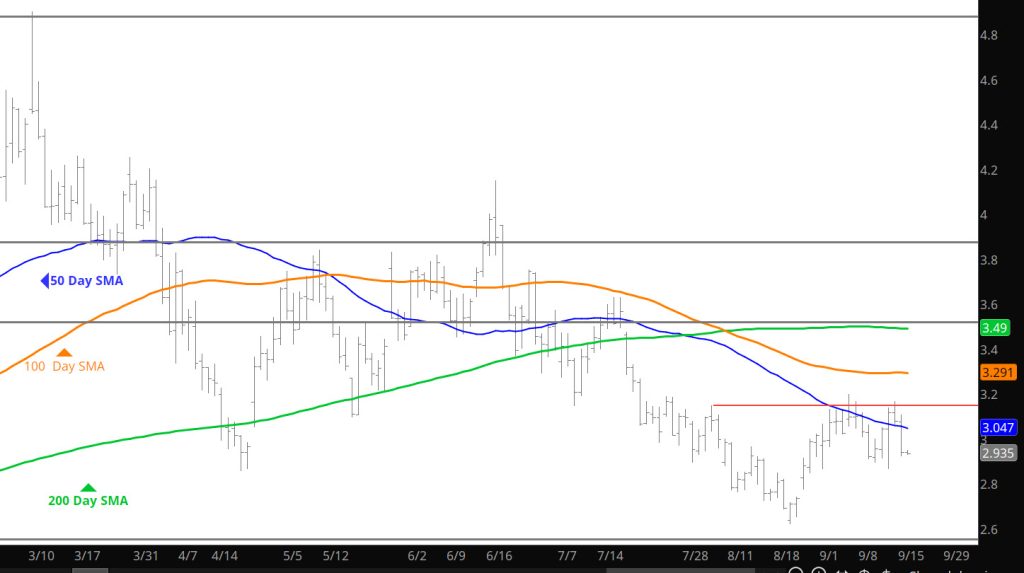
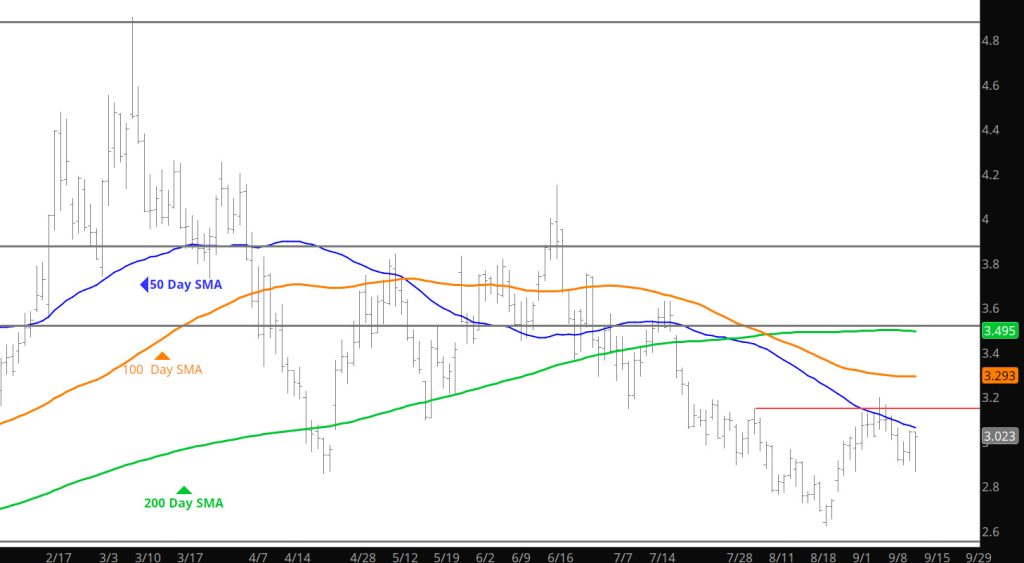
Leave For a Week –Nothing Has Changed

Daily Continuous

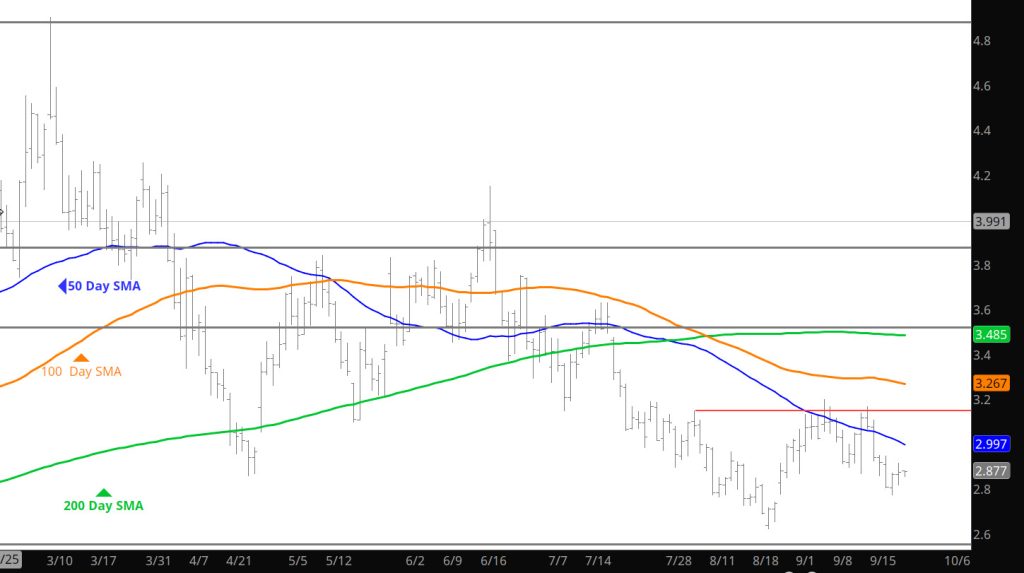
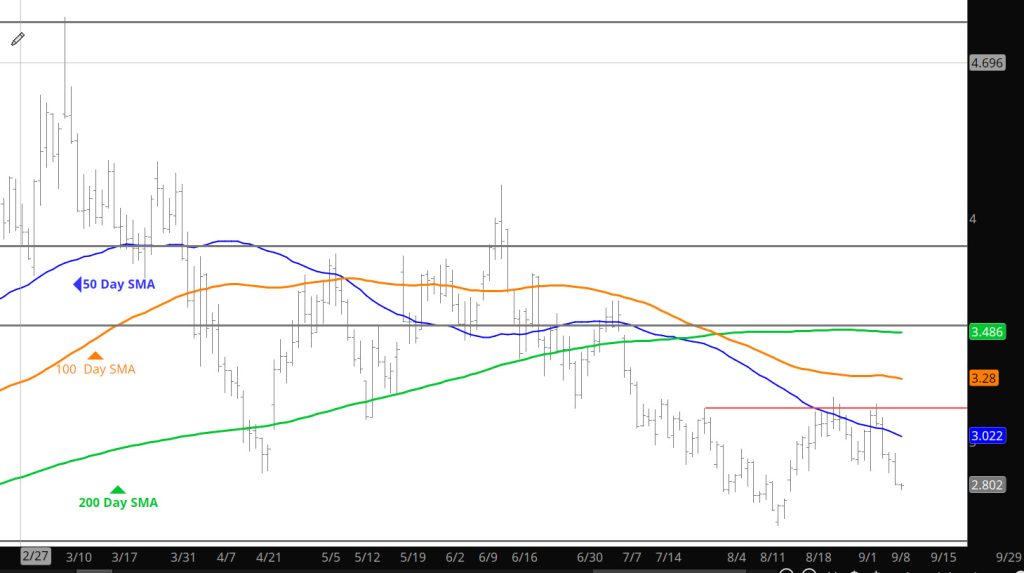
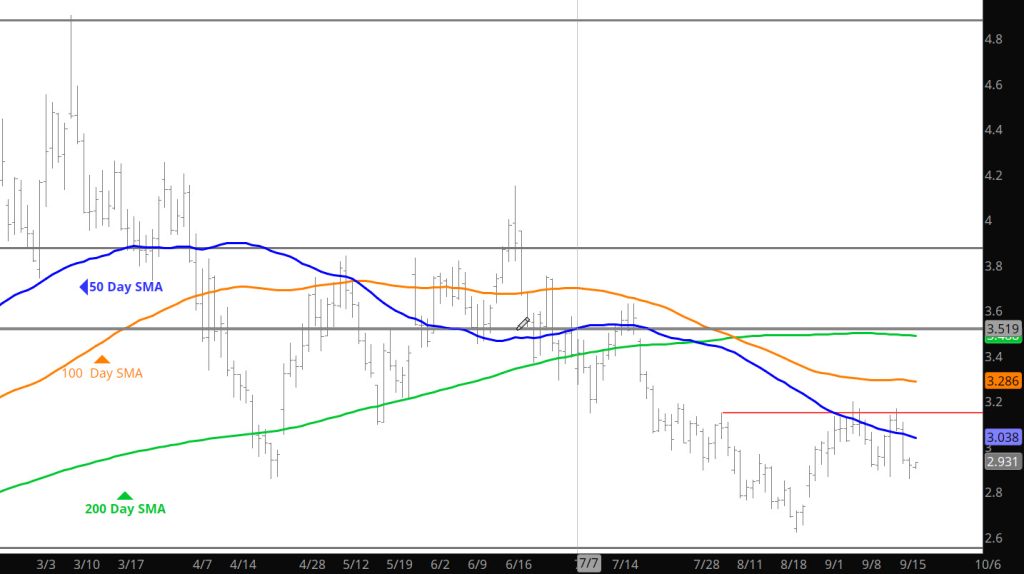
Discussed the ramifications and expectations in the Weekly area of last weeks expiration. There seems to be buyers supporting the declines at $1.90-$1.85. Not sure if it institutional buying or what but support is there. As discussed in the Weekly – there are some technical divergences showing up in the Daily regarding the momentum indicators so keep your eyes alert. Monday trade seems to want to retest the low side of the range.

Major Support:, $2.112, $2.026-2.00, $1.991, $1.93 ,$1.642, $1.605
Minor Support : $1.856,$1.89-$1.856
Major Resistance:$2.18, $2.25-$2.310, $2.39, $2.44-$$2.502, $2.618, $3.00, $3.16

To read The Daily Call you must be a subscriber (Current members sign in here. ) Start your subscription today.

Another Decline Into Expiration

Weekly Continuation

Back from the Canadian fishing and am not shocked at all to see what I missed. September fulfilled the expectation of declining into expiration as the eighth straight month to do so, and the fifth of the eight months that have expired in 2024 to trade the lows of their tenure as prompt coincident with expiration. Expiring September traded to the exact same price as expiring August as it went off the board. Both the calendar July and August lows were $1.856…leaving the remaining sliver of the 04/29 expiration gap still open between $1.848 and $1.856. Four weeks ago, when August first left the gap unfilled it was commented that it was clear that some folks were defending that gap and they still are.

A year ago expiring September also traded the August low (anniversary events are always interesting) after trading $.032 through the July low. A reversal from that low produced a bullish momentum divergence. The August low was the Q3 ’23 low and was not violated until 12/11. New prompt October, which was awarded $.167 premium over expired September immediately built on that premium gaining as much as $ .074 before fading to end the week still $.053/dt lower.

To read The Daily Call you must be a subscriber (Current members sign in here. ) Start your subscription today.

Weakness Begets More Weakness Going Into Expiration

Daily Continuation

Found an internet service on my travel’s and updated the Weekly section to bring you my insights. Due to the reduction of access I will use the Weekly section for my reference.

To read The Daily Call you must be a subscriber (Current members sign in here. ) Start your subscription today.

Expect Expiration Weakness

Weekly Continuous

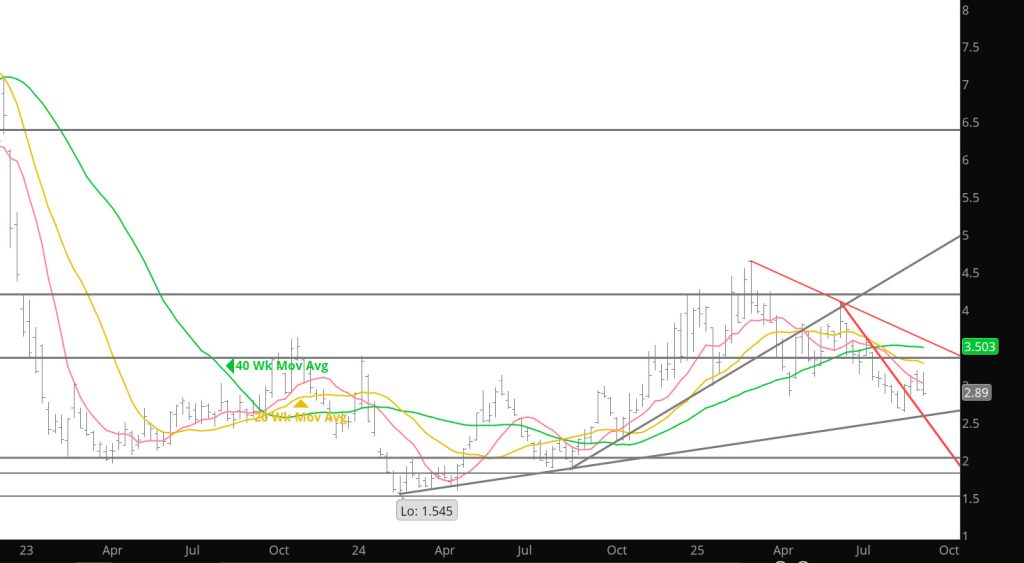
Discussed last week that weakness into the expiration was to be expected and now we have an expiration that the previous monthly expiration’s in 2024 have showed. There is nothing in the market that will prevent the trend from continuing. The more important question will be how much further the declines will occur. Still traveling but will be back after the holiday. n back – to – back weeks prompt September tried and failed to trade through convention resistance between +/- $2.250 and $2.300 and a confluence of declining moving averages…reversing lower after both attempts.

The continuation 10, 20 and 40 weeks SMAs are all declining and currently between$2.238 and $2.274, the high for the week was $2.278. Last week those averages were between $2.262 and $2.324, the high was $2.301. The weekly moving averages of the individual contract months are for the most part substantially higher…although the 10 – week of September is now $2.261.

Based on technical evidence provided by trade of the last two weeks the continuation moving averages are likely to continue to present declining resistance and guide the prompt and successor prompts lower until either the sponsorship develops to overcome the selling that will be coordinated with them or there is an “expiration” gap and weekly close higher…when they will likely act as support. Currently November with .555 premium over the soon to expire prompt, is the leading candidate.

Following the June Q2 high prompt gas closed lower for eight straight weeks (from weeks ending 06/14 through 08/02, For the last seven of those weeks prompt gas traded through the previous week’s low. A $.445 rally…less than a technically normal 38.2% Fibonacci retracement (the rally was 34.1%), that ended with a reversal from what amounts to first weekly resistance (the confluence of moving averages) is not technically constructive.

The twin weekly failures…both closing not far from their respective weekly lows, does not bode well for the near term future of about to expire September or prompt – in – waiting October which is currently awarded .158 premium.

2 b: A retest of the zone of support between $1.918 (the high of the high weekly close during March) the July low, $1.856 and the remaining sliver of the April 29th “expiration gap, $1.848 – $1.856…which is also the upper boundary of an eleven week trading range constructed between mid – February and late April , is suggested.

With that said, calendar August is still an “inside” month (within the range traded during July) and with only five trading days remaining ended the past week very close to where prompt September opened on August 1st ($2.046). From 2007 through 2017 the July lows were violated during August in ten of eleven years but have been only once during the last four years.

We are in the crux of that historically consistent price negative period (08/15 – 09/15). The twenty – year average of declines from “Q2” highs to “Q3” lows is 31%, the ten – year average is 25.9%, five years is 24.4%. Since the June 11th Q2 high prompt gas has already traded 41.3% lower. Perhaps the lion’s share of the seasonal weakness has already been discounted, but prompt gas has two other potential price negative tendencies to deal with.

Major Support:, $1.848, $1.52-$1.511, $1.481, $1.312
Minor Support : $2.00, $1.967- $1.94
Major Resistance:$2.18, $2.25-$2.310, $2.39, $2.44-$$2.502, $2.618, $3.00, $3.16

Retreating From Resistance Failure

Daily Continuous

First Off– will be periodically posting next week and will have sporadic Daily updates until September 4th, as I am traveling into northern Ontario Canada, which maintains limited internet access. Discuss the trading range that the September contract is likely to maintain in the next week or so in the Weekly Section. Will just add that the well offered contract prompt during the expiration is likely to continue. Whether it sets the low for the contract will remain to be seen.

Major Support:, $1.848, $1.52-$1.511, $1.481, $1.312
Minor Support : $2.00, $1.967- $1.94
Major Resistance:$2.18, $2.25-$2.310, $2.39, $2.44-$$2.502, $2.618, $3.00, $3.16

To read The Daily Call you must be a subscriber (Current members sign in here. ) Start your subscription today.

Historical Trend Seems to Continue

Weekly Continuous

First Off– will not be posting next week and will have sporadic Daily updates as I am traveling into northern Ontario Canada, which maintains limited internet access.

It looks like the market wants to challenge the low end of the trading range for the September contract. There seems to be no momentum to take prices back up to the failure of last week at $2.30. That behavior will likely continue during the remainder of the September contract. The almost always important 20 – weeks SMA is $2.243, the 40 – weeks is just above $2.300 and falling. In between is the zone between the low of week ending 07/12 and the high of the following week ($2.249 – $2.285) which was the terminal point of a rally attempt by then prompt August prompt. It is still August and the Q3 seasonal pressure should be expected to weigh on the gas market.

To read The Daily Call you must be a subscriber (Current members sign in here. ) Start your subscription today.

Run Ends at Several Resistance Levels

Daily Continuous

The price run ended yesterday at resistance levels from the lows of weeks ending 07/05 & 07/12 and the highs of weeks ending 07/19 & 07/26, $2.249 – $2.270 – $2.285 -$2.315. During the upcoming run into the annual Q4 highs this area will provide significant importance to any run.

Major Support:, $1.848, $1.52-$1.511, $1.481, $1.312
Minor Support : $2.00, $1.967- $1.94
Major Resistance:$2.18, $2.25-$2.310, $2.39, $2.44-$$2.502, $2.618, $3.00, $3.16

To read The Daily Call you must be a subscriber (Current members sign in here. ) Start your subscription today.

Strength Continues and Closes Above Initial Resistance

Daily Continuous

Action held firm for the day and closed above the initial resistance at $2.18. Storage comes out tomorrow so interest will be how the market trades and settles during the potential (light) volatility day.

Major Support:, $1.848, $1.52-$1.511, $1.481, $1.312
Minor Support : $2.00, $1.967- $1.94
Major Resistance:$2.18, $2.39, $2.44-$$2.502, $2.618, $3.00, $3.16

To read The Daily Call you must be a subscriber (Current members sign in here. ) Start your subscription today.

Yesterday All Over Again

Daily Continuous

Did you read yesterday’s Daily? Let me remind you… After extending gains to test the 100 day SMA, traders backed off the positive momentum of price action to consolidate at the days low. While not breaking out above– it will be today’s trade to see if prices are just going to decline and retest the recent support zones a dime around $2.00. The historical tendency for September has been to trade the high of its tenure during the first two weeks of the calendar month but there have been a few strong Augusts in recent years. A year ago, September conformed to the historical tendency. After falling to forfeit about a dime premium that had been awarded over expired August September ‘23 rallied from an 08/02 low ($2.457) to an 08/09 high ($3.018). In ’20, ’21 and ’22 September remained well – bid into expiration. This action was set up only to give back a chunk of those gains during calendar September (the Labor Day seasonal largely responsible).

To read The Daily Call you must be a subscriber (Current members sign in here. ) Start your subscription today.

Brief Consolidation of Recent Gains

Daily Consolidation

After extending gains to test the 100 day SMA, traders backed off the positive momentum of price action to consolidate at the days low. While not breaking out above– it will be today’s trade to see if prices are just going to decline and retest the recent support zones a dime around $2.00. The historical tendency for September has been to trade the high of its tenure during the first two weeks of the calendar month but there have been a few strong Augusts in recent years. A year ago, September conformed to the historical tendency. After falling to forfeit about a dime premium that had been awarded over expired August September ‘23 rallied from an 08/02 low ($2.457) to an 08/09 high ($3.018). In ’20, ’21 and ’22 September remained well – bid into expiration. This action was set up only to give back a chunk of those gains during calendar September (the Labor Day seasonal largely responsible).

Major Support:, $1.848, $1.52-$1.511, $1.481, $1.312
Minor Support : $2.00, $1.967- $1.94
Major Resistance:$2.18, $2.39, $2.44-$$2.502, $2.618, $3.00, $3.16

To read The Daily Call you must be a subscriber (Current members sign in here. ) Start your subscription today.