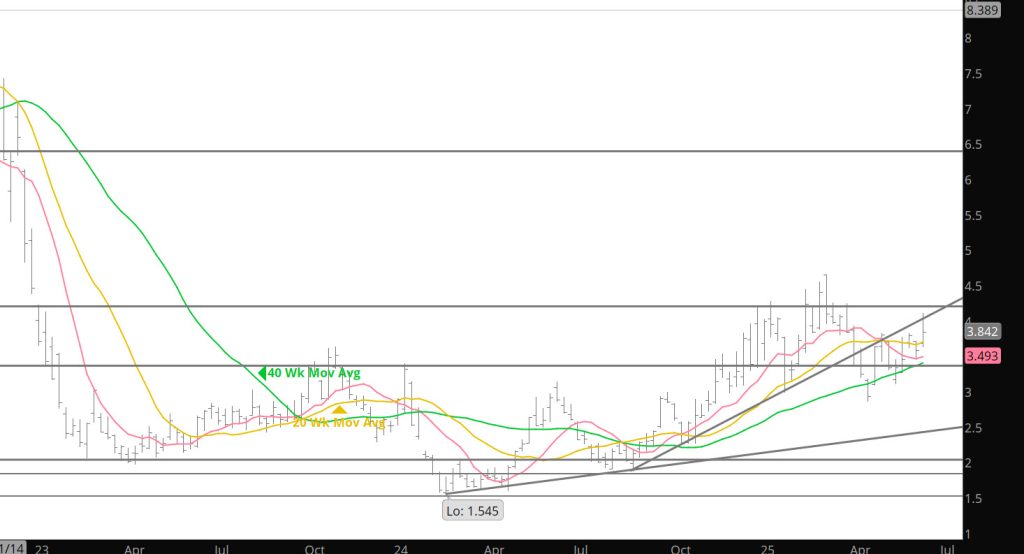
The market is approaching one of the most consistently price negative periods all year. For those that care about such things, I can provide a schedule Larry Marshall has maintained since 1995 if you need to see it. The declines bracketing Independence Day which shows a quantifiable decline usually from a mid/late June high to many times a just post – holiday low. While some of the declines are negligible (just 6.2% in ’19) and some are dramatic (35.7% in ’08) the 3, 5, 10 and 20 – year averages are pretty consistent, 14.1%, 13.7%, 13.5% and 16.4%. The 3 – year average 14.10%, the 5 – year average is 13.68%, and the10 – year average 13.47%. Refresh your memory in 2024 the June pre-holiday high at $3.159 to the early July low at $2.249– before extending the declines through July to early August– setting the low of $1.882. Looking at last week’s rally as the pre-holiday high at $4.148 a similar decline to the historical averages would indicate a $.58ish decline around or after the holiday.
Not sure how the mid-east issues will impact gas prices as the crude prices will be well bid going into the week. Think it would be prudent to sit on the sidelines until the response from Iran gets defined.