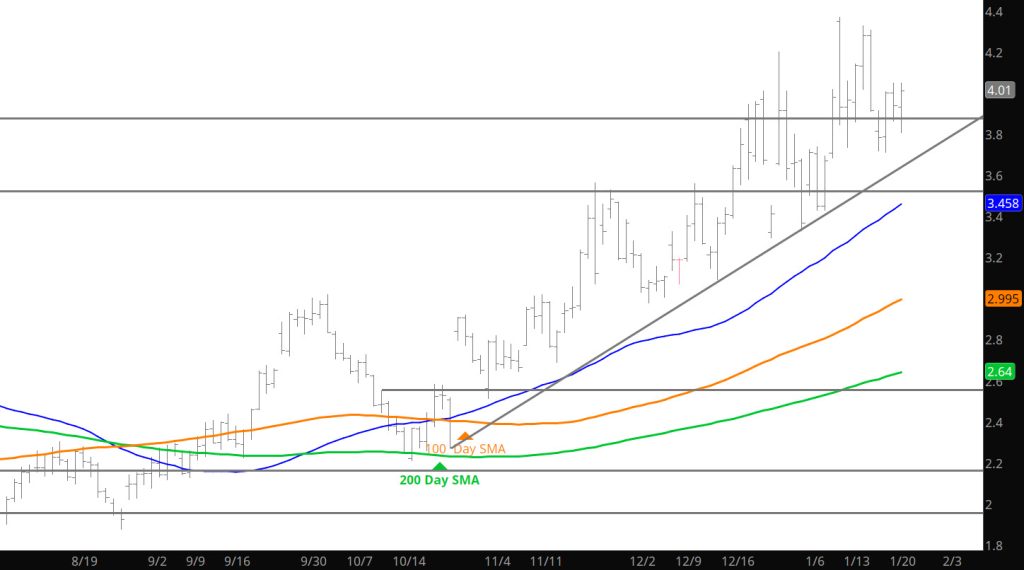
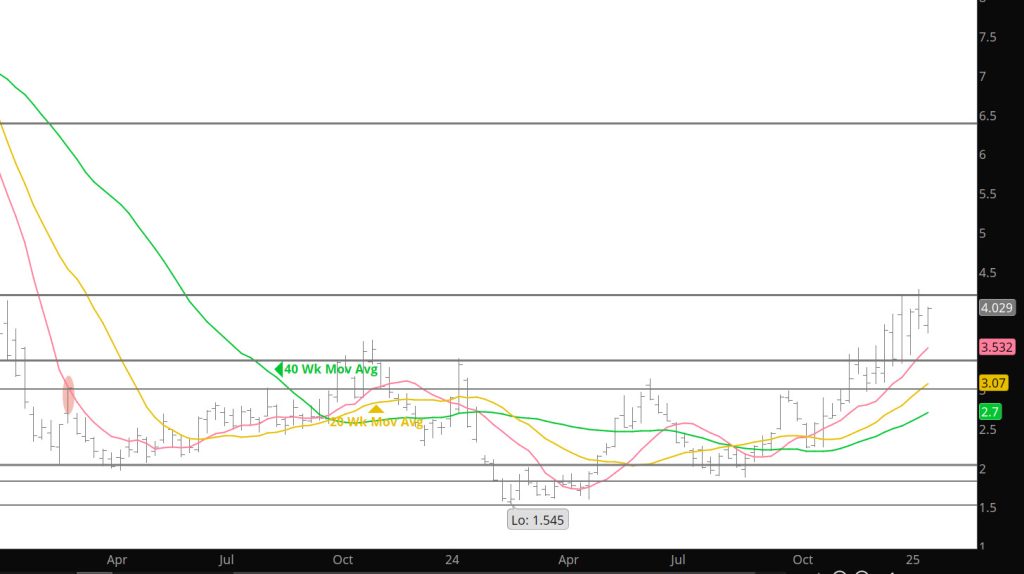
The most interesting near term technical factor is the trend line rising from the continuation October low (see Daily chart above). Similar trend lines rising from the December lows of February and March gas (See March gas below) were tested during the past week. Each time their recovery from the rising support attracted less volume.
Going into expiration period over the next three days. Expect the trend line to continue to guide prompt gas higher toward resistance defined by the zone between the December and January highs. Should the trend line (support) violation break — it likely to announce the beginning of the decline toward a late Q1/early Q2 seasonal low. Expect significant moderation of price as we progress through Q1. The average decline from Q4/Q1 highs to late Q1/early Q2 lows is a little more than 40% for successive prompt months, less for deferred months. There is likely to be a substantial “expiration” gap after February expires. That gap will provide the market important resistance to an extension of any rally in March gas.