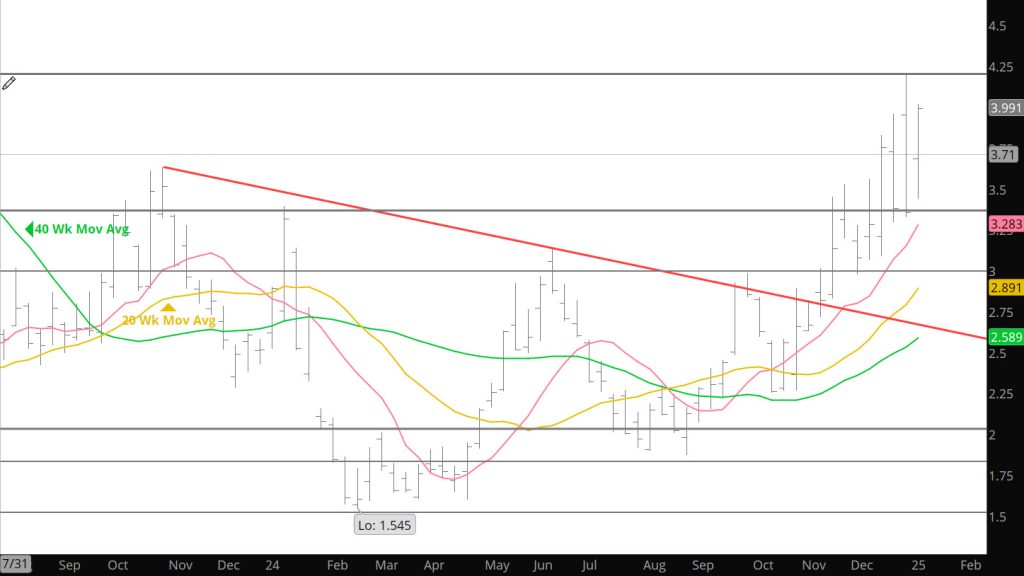
A significant technical factor was Friday’s higher daily close, which leaves the daily closing trend intact. The trend of a series of higher lows…and now a higher high since prompt November closed at $2.258 on October 17th. This week’s close at $3.989 validates last week’s higher low at $3.354 and suggests trend continuation. The higher weekly close (see Chart above)…the highest since the beginning of 2023 (and above the 2016 weekly closing high) tends to confirm the breakout from a lengthy flat base. There is little definable weekly closing resistance other than a low close in February ’22.
At the low daily close in October the daily ATR (a measure of volatility that is essentially the average range of the last fifteen days), was $.119 and has more than tripled since then to $.359. Comparatively, during the rally from the April low to the June Q2 high the daily ATR increased from $.091 to $.205. Following the January ’24 high the peak was $.312 (the peak of the ATR usually lags the price high). The highest calculation of the last several years was $.769 in June ’22.