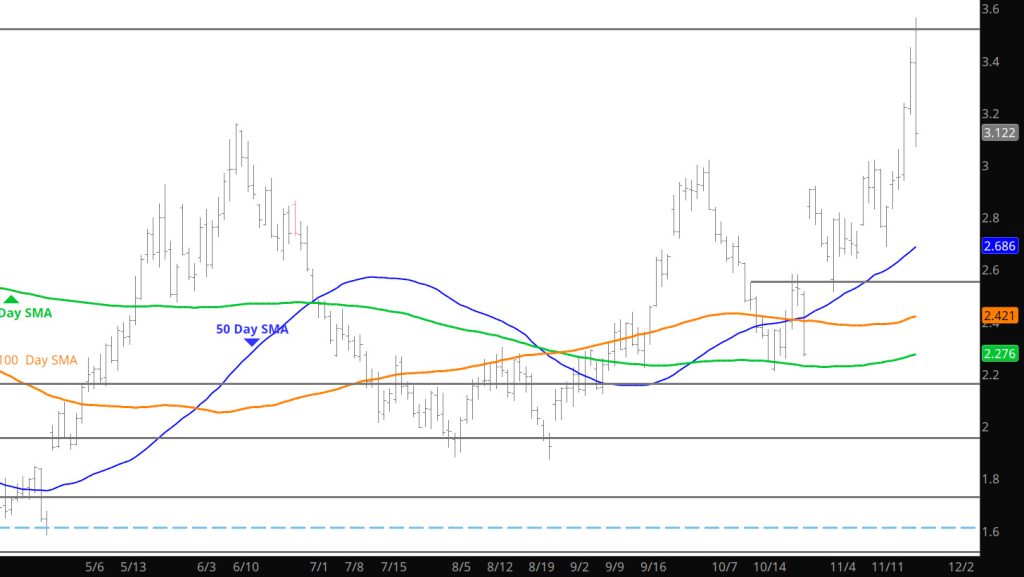
Weekly Continuation
On a weekly closing basis December gained $.306, the largest gain for a prompt contract since the week before the October high (which included the premium awarded to November over expired October). The only greater weekly gain during calendar ’24 that did not include expiration premium was the week of the January high ($.42)…a high that was finally exceeded on Thursday. Interestingly the high daily close prior to this week was $3.313 on 01/12, the high daily close for ’24 is now $3.339 (11/21).
Despite its weekly gain, soon to expire December ended the week at $3.129 and was well below the midpoint of the week’s range, $3.317. Two weeks ago, I discussed the implications of the substantial increase in open interest from October 9th (1,488,043) through the all – time high on November 8th (1,801,183). In every historical example after such a rise in open interest during an extended period of definable range bound trade is the same…price rises. From the close on 11/08 ($2.669) through the close on 11/21 ($3.339) the number of contracts outstanding fell for nine straight days from 1,801,183 to 1,643,514. That makes 157,669 contracts that were bought to cover contracts previously sold short and a major contributor to the extension of the Q4 rally to 98+% since the August low at $1.846.
Since the aftermath of the failure of prompt gas at January’s lower weekly closing high ($3.331 v $3.473 on 11/03/23) there is the tendency of the gas market to trade lower highs $2.937 in June and $2.921 at the end of September. This week’s close was the first higher high ($3.129), which increases the importance of higher lows traded during March, July – August and October – November discussed in previous Weekly reports.
Another topic of repeated discussion has been that natural gas has constructed and been confined in what has been called a “macro” wide, extended range since mid – January 2023. When December traded through the October high ($3.019 on 11/19 which had been the upper boundary of a shorter – term range (since early September, the prompt wasted little time challenging and closing above the June high, which had been the upper boundary of an intermediate term trading range constructed since the Q2 high. The following day December challenged the January high and set the new high close for calendar 24, and the following day began a test of the upper boundary of the “macro” range (a high that has confined successive prompts for nearly two years). More than one million contracts traded on Thursday as December progressed toward that test (there have only been five other trading days in the history of natural gas trading that as many contracts changed hands in one day). December failed that test in classic fashion, but volume declined as the prompt fell (an estimated 740,000 contracts v more than a million).
Given that decline (lower price, lower volume) and the week’s close above the upper boundary of the most recent defined range, above the trend line declining from January, June and October highs and the December and January contracts closing above their respective 50 – SMAs, during Friday’s volatile session, the presumption that prompt gas will remain confined in that range for the immediate future.
Major Support:,$2.727-$2.784, $2.648, $2.39, $2.35, $2.112,
Minor Support : $3.16, $3.00, $2.914, $1.856,$1.89-$1.856
Major Resistance: $3.307 $3.392, $3.487
