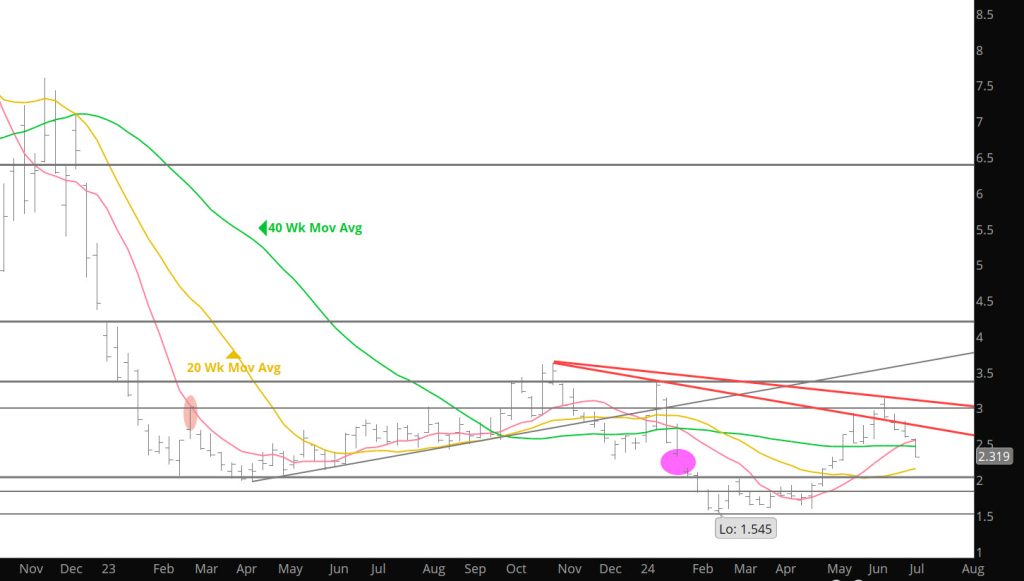
The case was made that conventional and moving average support would provide a floor for the historically consistent price decline bracketing Independence Day — to say the least –it didn’t. Since a day before July went off the board (06/25) amply offered August gas has closed lower for eight straight days. Add to that, the prompt plus the last two of July’s, and at Friday’s low retraced 50% of the rally from the March Q1 low to the June Q2 high.
The historical averages for the seasonal decline (per the chart provided previously) were: 20 years, 16.4%, 10 years, 13.5%, 5 years 13.7%. The following is an update summarizing the recent declines and the results: