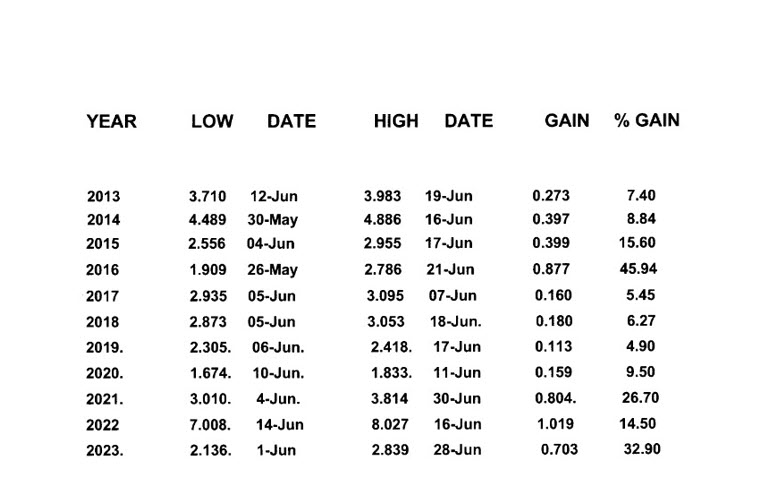
Spoke about the history of trade during June after the Memorial Day weakness. Below you see the trades from the lows (date and value) and the rally date setting the high (date and value).
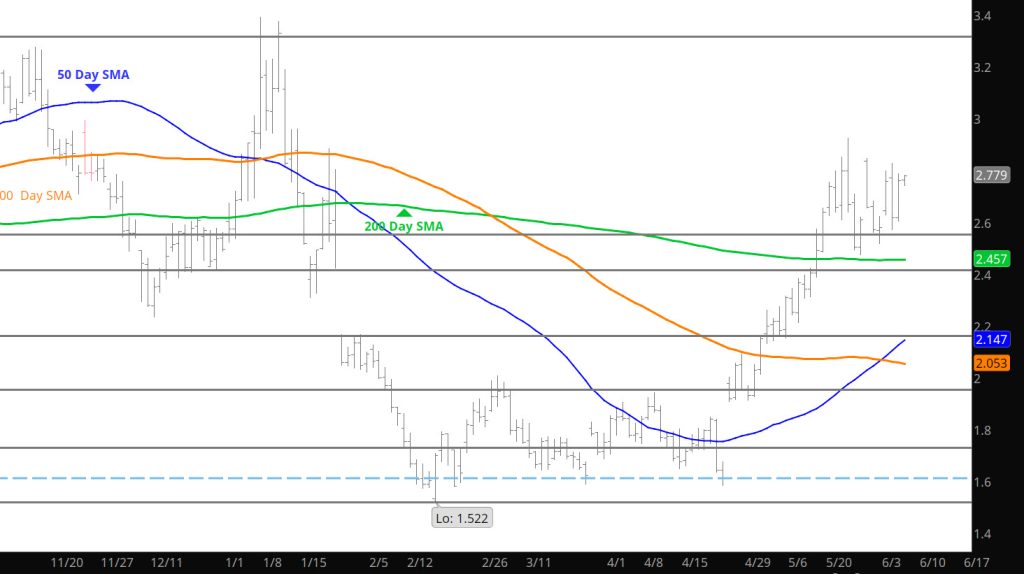
The average percentage gains over the last 10 years is $.481 or 17.06%. This chart shows why the case has been made that prices rally in June setting the high for the month sometime towards the middle of the calendar month. The daily trade behavior seems to be similar to 2023 and would use this as the base case for the coming month.