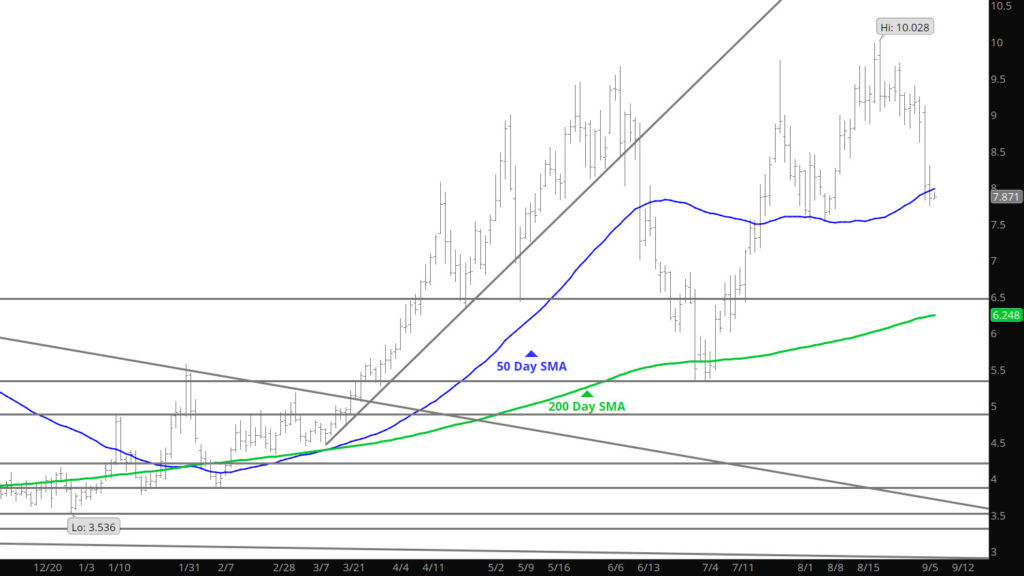
The twenty – years average of the seasonal declines for the weakness from the mid August high to the Labor Day low is 16.35%, but in recent years the decline has significantly moderated. With the high of $10.04, continuous chart, last month and the low from yesterday at $7.751 the historical average has been met and surpassed (nearly 23% decline) . Whether on time, a little early or a little late, apart from the late summer on ’00, since natural gas began trading at the NYMEX in the spring of 1990 a period of price weakness is consistently distinguishable between mid – August and mid – September. We just don’t know if the declines are over or is there more room to go.
Major Support: $7.956-$7.91, $7.55, $7.14, $7.078, $6.88, $6.754,$6.38, $6.02, $5.623, Minor Support $7.35, $7.41, $6.42, $5.548, $5.40-$5.45 Major Resistance: $8.58-$8.61, $9.021, $9.35, $9.40, 9.664–$9.67, $9.98