Continuous Range Remains

Daily Continuous

The range that started last month continues into this month. Last month’s low was not severely tested before prices started to rebound. The interesting aspect of the range trade is does it test the resistance near $6.00 or above. Unfortunately, there is no technical indication of expansion beyond resistance, nor is there indications that prices will retreat again.

Major Support: $5.275, $5.17, $4.88-$4.825, $4.61, $4.537,$4.375, $4.211, $4.156, $3.92
Minor Support: $4.728-$4.70, $4.66
Major Resistance
:$5.47, $5.568, $5.96, $6.00

To read The Daily Call you must be a subscriber (Current members sign in here. ) Start your subscription today.

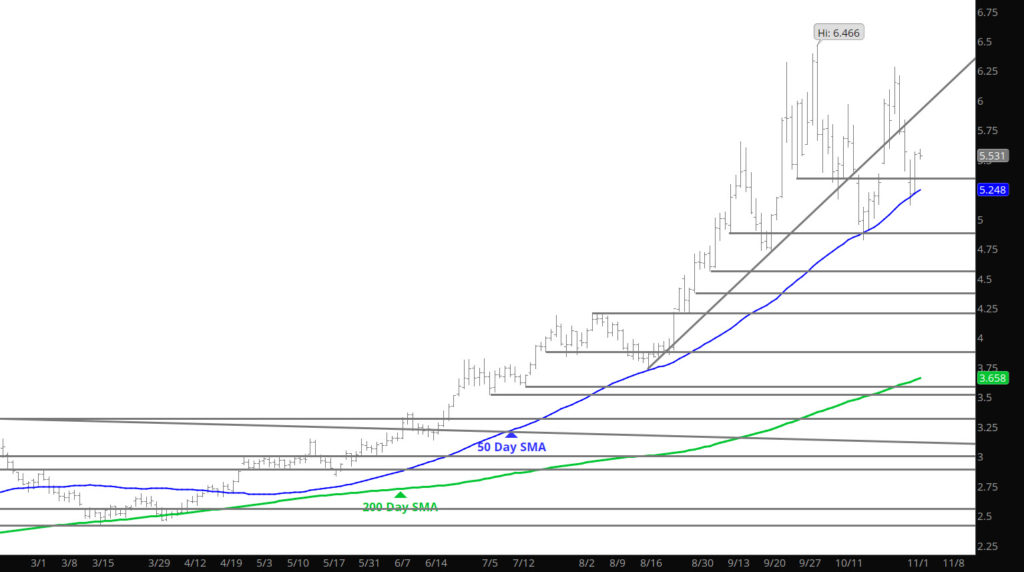
Commonly Watched Support Holds

Daily Continuation

This analyst rarely uses the moving averages as an analytical tool in technical analysis, but it is a fact that many trading firms use averages in their algorithms. Due to this well known trait — it is not surprising that the 50 Day SMA received support yesterday, just as it did in August and October when challenged. What is more important is the movement after the test — does the market realize the test is a necessary part of developing a base or the initial movement in a collapse of the rally. Seems like a low risk opportunity to add length with tight stops.

Major Support: $5.275, $5.17, $4.88-$4.825, $4.61, $4.537,$4.375, $4.211, $4.156, $3.92
Minor Support: $4.728-$4.70, $4.66
Major Resistance
:$5.47, $5.568, $5.96, $6.00

To read The Daily Call you must be a subscriber (Current members sign in here. ) Start your subscription today.

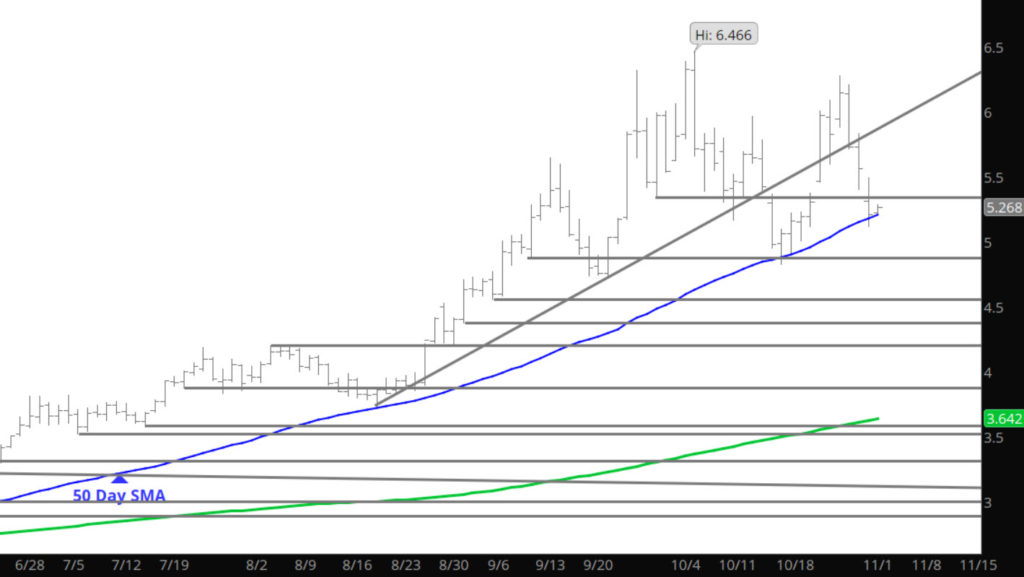
Sunday Night Closes Gap

Daily Continuation

The small gap left from last week on the Daily and Weekly charts (last Monday opening) started to be closed last Friday and now has been closed in the early trade on Sunday night. From here, extensions to support zones should continue during the upcoming week. Though the declines have been startling the market has still not traded to a lower low (discussed in the Weekly) and remains in the current (one year plus) bias.

Major Support: $5.275, $5.17, $4.88-$4.825, $4.61, $4.537,$4.375, $4.211, $4.156, $3.92
Minor Support: $5.489, $4.728-$4.70, $4.66
Major Resistance
:$5.47, $5.568, $5.96, $6.00

To read The Daily Call you must be a subscriber (Current members sign in here. ) Start your subscription today.

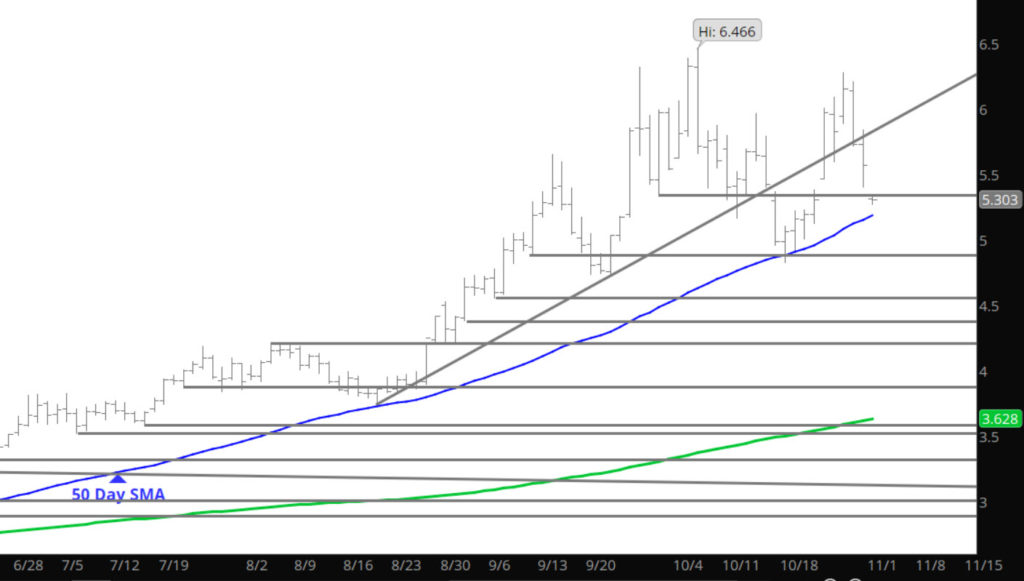
December Breaks Lower Tests Nov Support

Weekly Continuation

November was the eighth straight monthly contract to rally into expiration and settlement, the highest settlement since December ’08 went off at 6.888, was the eighth consecutive higher than the immediately preceding month. After last week’s gap lower (5.379 – 5.400) this week’s gap higher ($5.379 – $5.462narrowed on Friday to $5.379 – $5.400) left a rare “island” reversal. Expect that gap to be closed this week. The market hasn’t seen one of those since the November ’19 high. Whether this “island” survives or not, the current conditions that led to its occurrence are significant technical factors similar to what they were nearly two years ago.

During calendar October prompt (Nov) gas defined or perhaps more reconfirmed old support and resistance levels. Both the September and October highs were within a zone of resistance between the January ’09 and February ’14 highs, the October ’21 low between highs traded during Q4 ’18. Still, within that wide area prompt gas continued the more than a year-old pattern of trading higher lows and higher highs (discussed in the fall of 2020 and re-confirmed this past summer at Ecom) the primary characteristics of an uptrend. Unless and until that pattern is broken and the support zone between the September and October lows ($4.825 –$4.735, the last higher low) the technical assumption is that the uptrend will continue to higher highs.

To read The Daily Call you must be a subscriber (Current members sign in here. ) Start your subscription today.