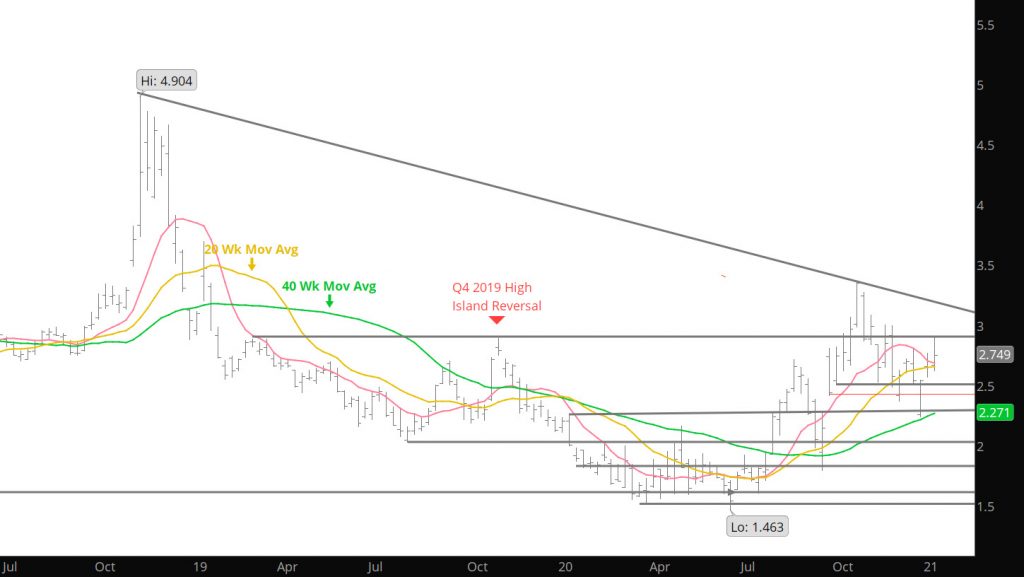
Prices challenged resistance that I did not consider as it hit the highs from Nov ’19 (see Chart below) which had long since been traded through but I left it on the Weekly chart:
Weekly Continuous
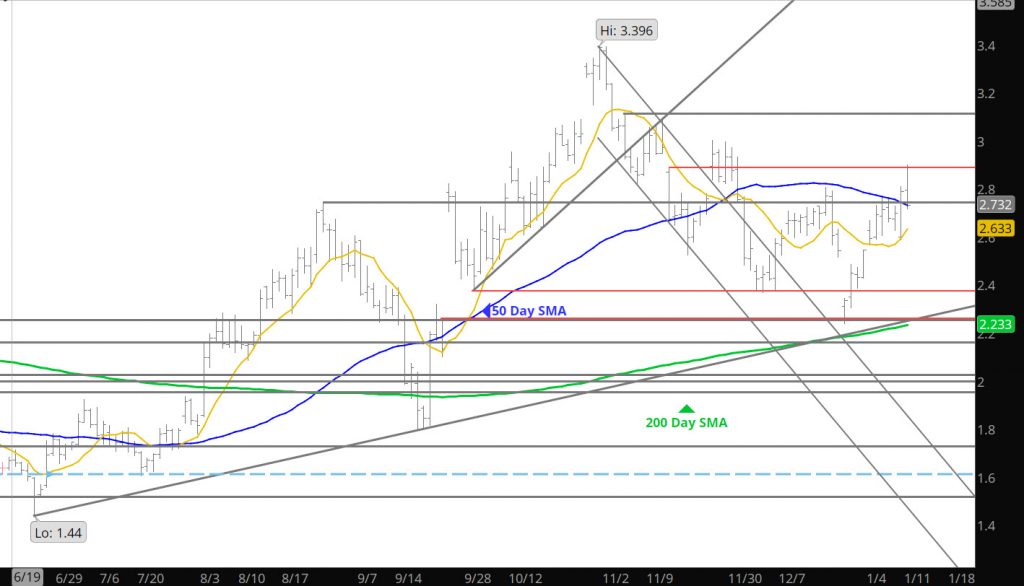
From the highs, the market reversed, gradually melting down and then collapsing at the end of the trade day. Not sure what spooked the rally up to the highs, but now the market has successfully tested resistance, expect the market to test support. Question is which level of support- The gap from the beginning of the year should be included in the longer term mix– but before that look at the area either side of $2.70 to provide near term support.